DailyUI Challenge 018 - Analytics Chart

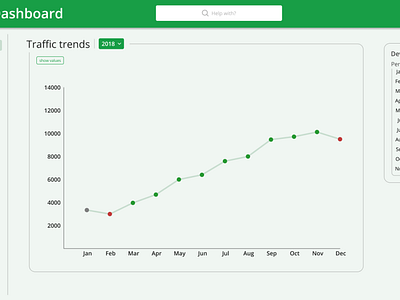
The eighteenth challenge was to design an analytics chart.
The single chart reports the visitor count for a website for a period of one year. The report can be for other years can be viewed if hovered and clicked on the year name.
#DailyUI
_____________________________________________________
Link to prototype: https://www.figma.com/proto/tYsSxtYYSYwr2IljTcYRWQ/DailyUI-018?node-id=3%3A644&scaling=min-zoom