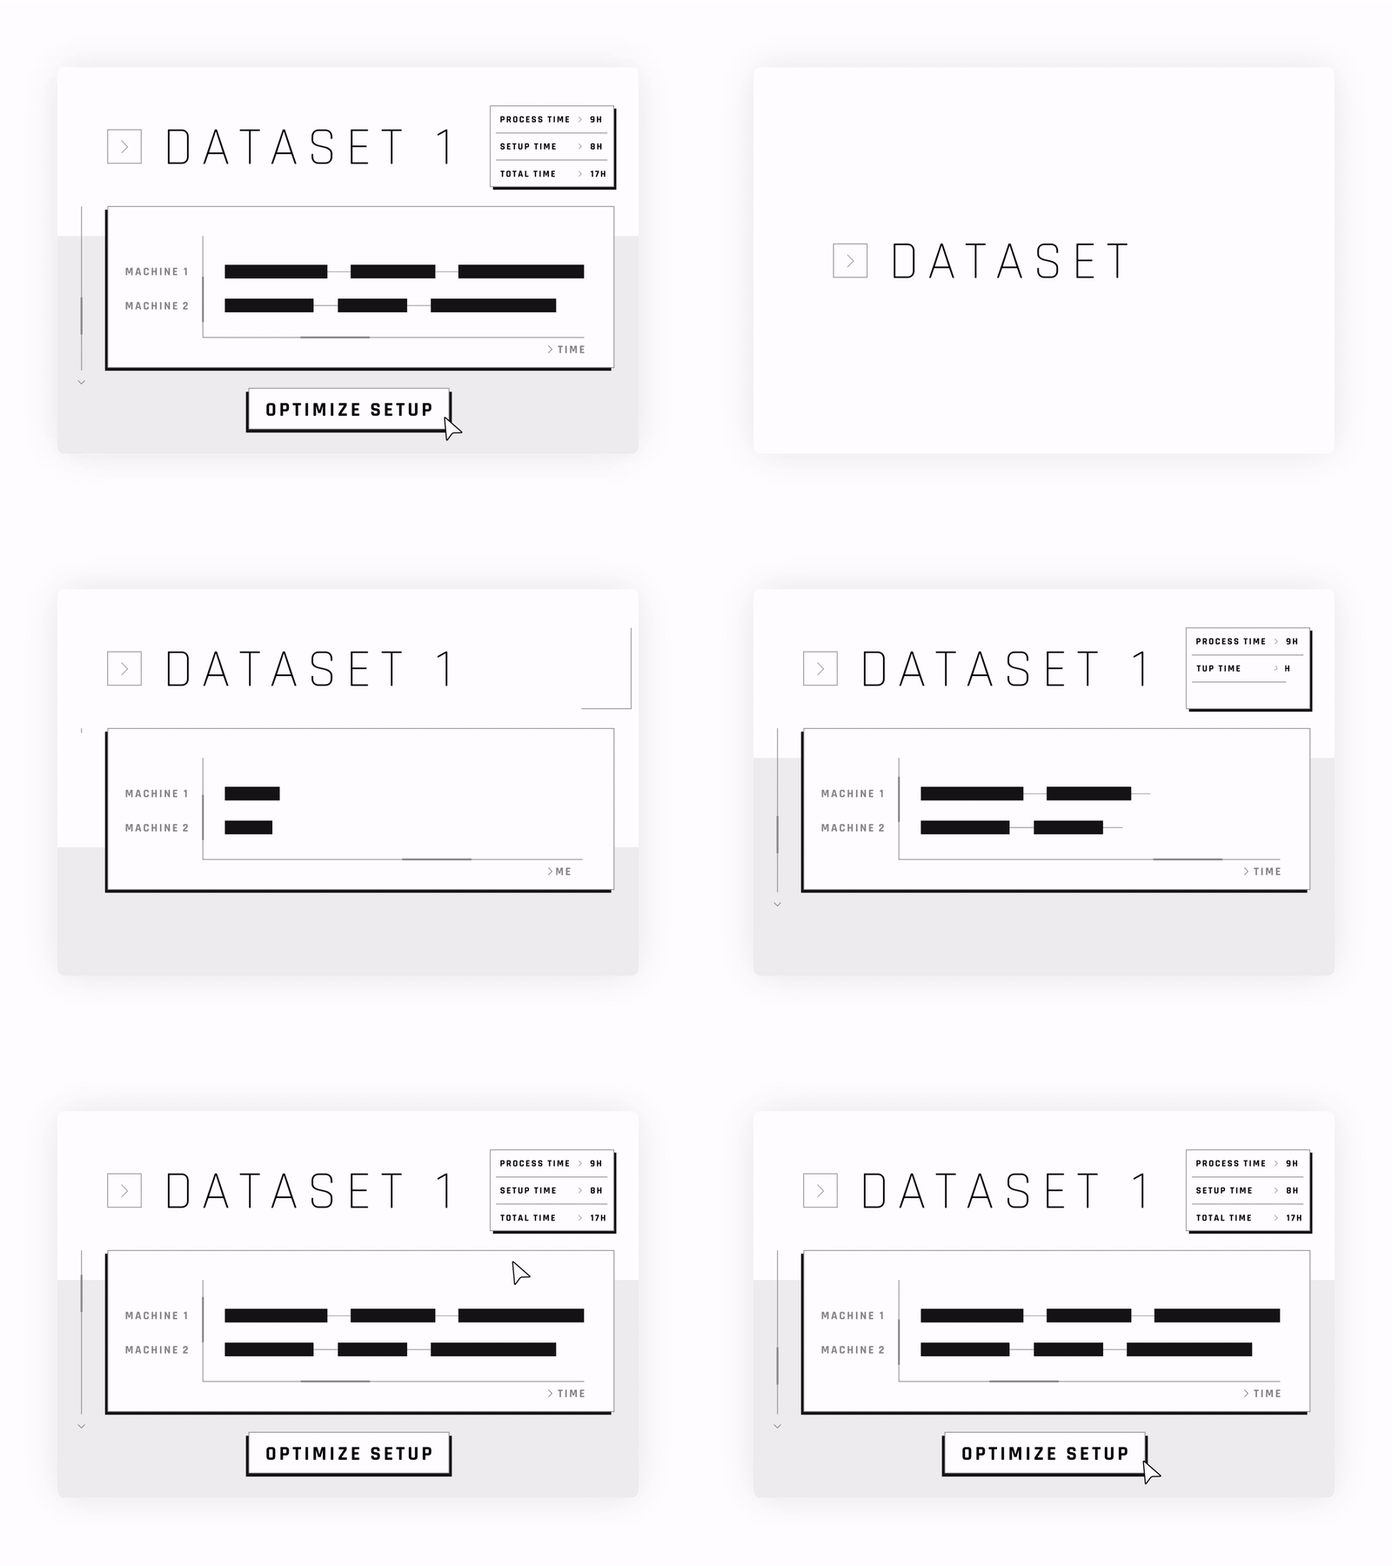
DATASET CHART / Animated Data Visualization
Brazil / 2020
Animated data visualization created to illustrate how a chart comparing machines and their optimization potential would function on the company's website. This dynamic visual highlights key differences and benefits, enhancing user engagement and understanding.
More by Rodrigo Schwambach View profile
Like
