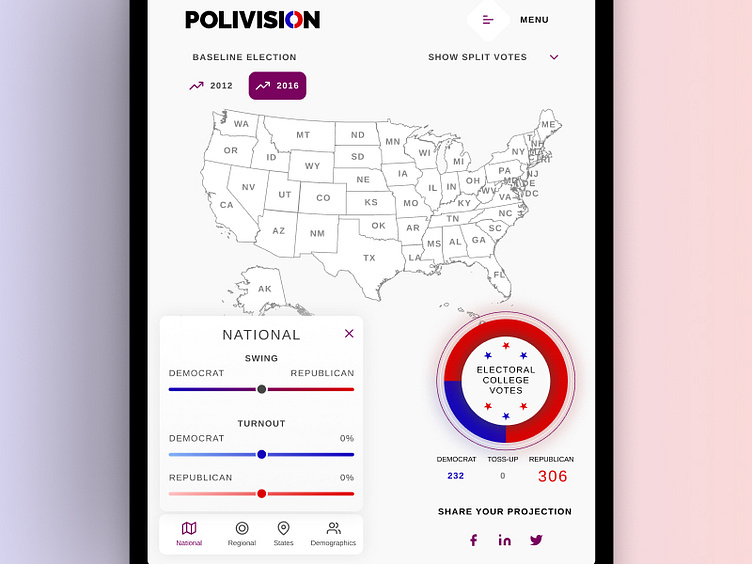
Polivision, the interactive, data driven map
Polivision, the interactive, data driven map designed and built by us was recently released leading to the 2020 US elections. Using swings, turnout, and demographics to build a path to 270 electoral votes, the user can predict a winner to a granular level.
The complexity of platform (both front and back-end) made this a Desktop-first approach, with a limited, yet effective experience on mobile and tablet.
So much data and for a specific target audience, precision was at the forefront of the user interface, user experience and development.
More by Oliver Muñoz View profile
Like
