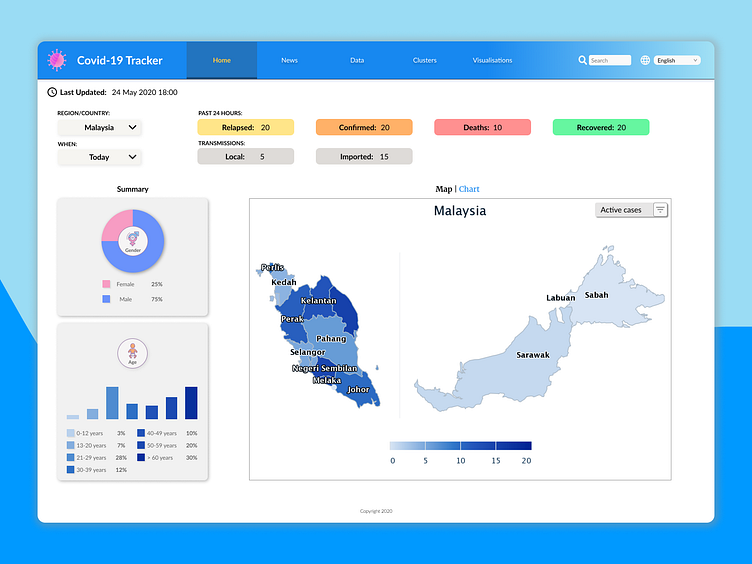
DailyUI 018 - Analytics Chart (Covid-19 Tracker)
Day 18 of Daily UI - Analytics Chart (Covid-19 Tracker) I decided to design a simple analytics chart for tracking Covid-19 cases as the ones on the market are data-oriented, with less visualizations. Data-oriented tables usually over load users with information and is not intuitive for users who are more concerned with specific countries.
Disclaimer: This is just design work for educational purposes only. It does not exist in the commerical market. Data is made up and does not reflect real statistics.
Fonts: Lato Made in Figma.
More by Kimberley Chong View profile
Like
