Correlation Chart Ui design - Figma templates kit
Charts UI kit for Figma
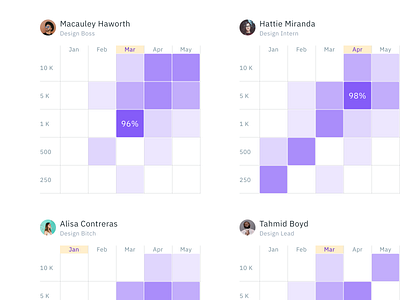
A correlation chart or correlation matrix represents the table that indicates the correlation coefficients between different sets of variables
Figma charts library made of components. Contains most common data visualization patterns from simple bar charts to complicated heatmaps and financial candlesticks. Fits for infographics, dashboards, presentations, visualizations or any other type of data-design projects.
Figma Charts & Infographics UI kit (Community).fig
30 MB