Steps Graph
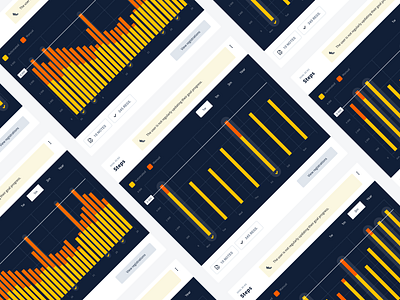
A sneak peak of my latest project. Redesign of a dashboard.
The graph is visualizing the progress towards a goal, and highlights the days when the goal has been achieved. Next to the graph there is an AI which interprets the inputted data.
