May 24 Statistics
🇷🇺Рус
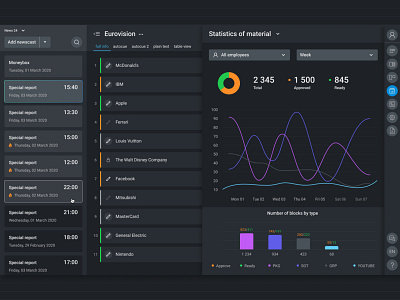
Для отслеживания продуктивности команды необходим простой и понятный интерфейс. Представляем вашему вниманию dashboard may24, в котором можно посмотреть статистику по проектам всей команды и отдельного сотрудника за выбранный промежуток времени и сравнить результаты!
🇺🇸Eng
A simple and intuitive interface is required to track team performance. We present to your attention dashboard may24, in which you can see statistics on the projects of the entire team and an individual employee for a selected period of time and compare the results!
More by KARELIN.cc UI/UX Design Agency View profile
Like
