Data Graph with Flot
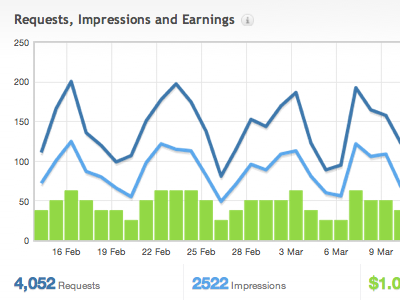
A chart that shows your ad requests, ad impressions and how much money you made based on 7 or 30 days.
Pretty neat because you can evaluate your earnings compared to fill-rate and many other factors.
More by Matt Haltom View profile
Like
