Alternate view of graphs for dashboard
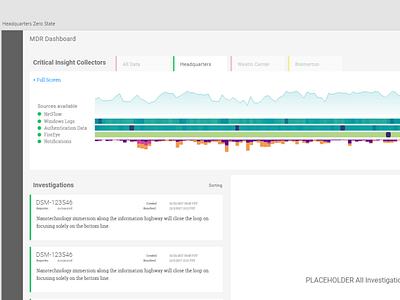
This was a next iteration of the dashboard in order to find a way to show the information with less real estate taken up. We settled on 2D heatmaps to handle some of the information.
This was a next iteration of the dashboard in order to find a way to show the information with less real estate taken up. We settled on 2D heatmaps to handle some of the information.
