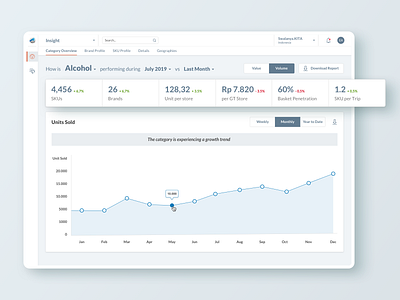
Emporio Analytics Alcohol Product Dashboard
An efficient way to display information on a dashboard is to use the concept of a pyramid — where the top of the dashboard displays high level information and as the user drills down into more internal pages, the information starts getting more detailed and granular. By applying the pyramid approach, the information will be structured in a streamlined manner and would be easy for the user to absorb and access.
Here's an example of how we did that for the Emporio Analytics dashboard.
More by Flolab View profile
Like
