Next 2.0 - Statistics (Animated)
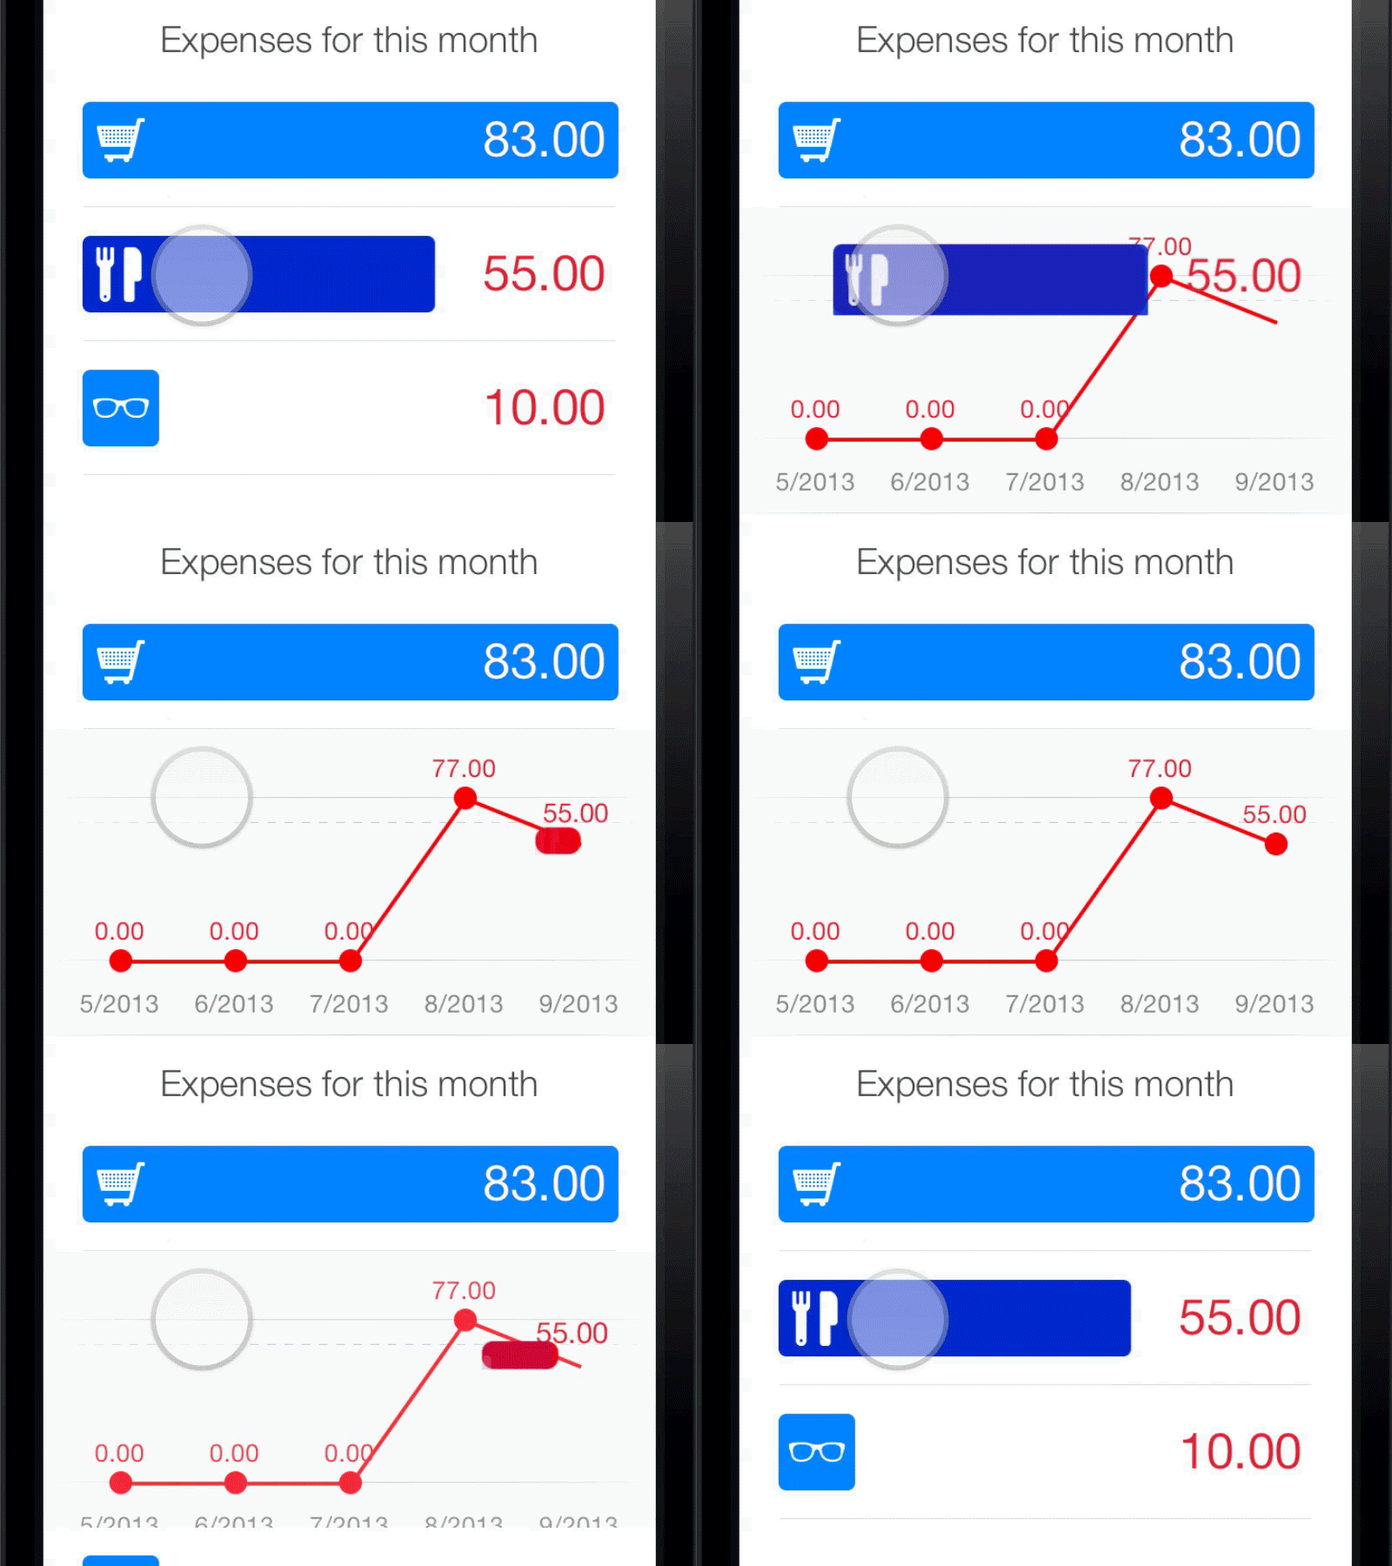
In Next you can reveal a graph of the expenses of the past months by tapping on a row. So we made this animation where the bar "morphes" into its datapoint. Here it is in slow-motion, in the app it's faster of course :)
I think I played for hours (if not days) to get this animation coded right. It was huge fun.
This is the App btw: https://itunes.apple.com/us/app/next-expense-tracking/id596366290?l=de&ls=1&mt=8
More by noidentity View profile
Like
