Data Visualisation for Annual Report
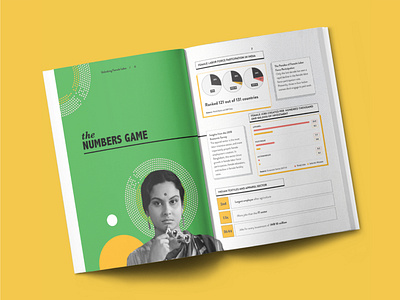
Full page layout of infographic depicting statistics on female labour force participation designed for an annual research publication.
Read more on how we designed editorial artwork to make research more accessible: https://smarterthanawaffle.com/goodbusinesslab/