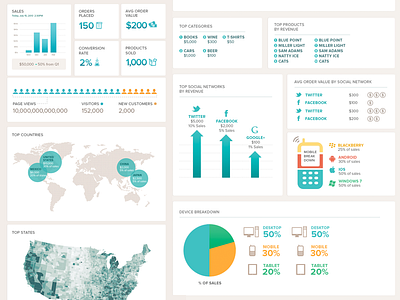
Google Analytics E-commerce Infographic in HTML/CSS
Turn your Google Analytics e-commerce metrics into a visual infographic. It only takes a few seconds to connect your Google Analytics account with Shopalytic. Once connected we will email you a custom infographic for the period of time you select. We offer weekly, monthly, and quarterly reports. You can choose to generate the report one time or subscribe and have reports automatically sent directly to your inbox.
More by Cat Lo View profile
Like

