Tag Data Visualization
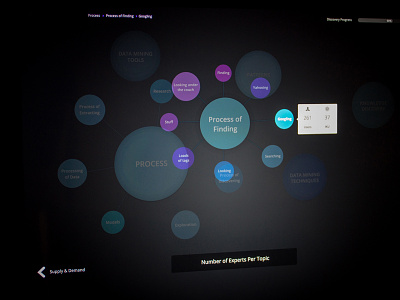
Here is a concept I was working on for visualizing tags. Each tag was part of a sub category which is part of a top level category, this is my way of representing the hierarchy. The bubbles would have physics applied to them.
Follow me on Instagram to see more of my work. I post more often there than dribbble.
And on Twitter if you want to chat.
More by Mike Busby View profile
Like
