Free sugar intake - infographic
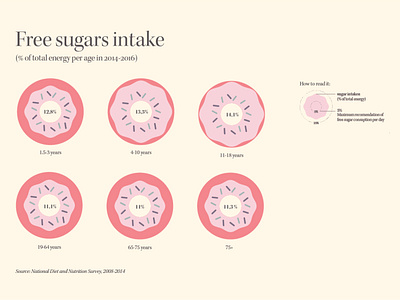

This is a simple infographic that shows the % of sugar intake of total energy per age.
I decided to represent each group age by a donut and the pink frosting represents the extra sugar that each group is ingesting beyond the 5% recommended daily.
