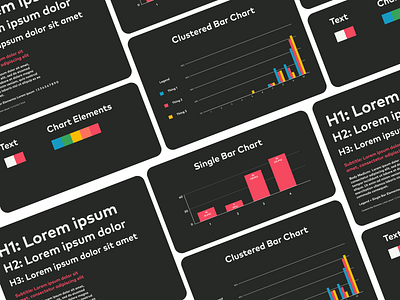
Design System for Data Visualisation
I currently work for @obvious_hq as an intern. I volunteered for an assignment where I had to visualise the results of a survey. A pain point I encountered was a lack of a style guide for data visualisation.
So I made one. Right now it only exists for bar charts, but over time I hope to add others like pie charts, line charts, etc
More by Chandra Ramanujan View profile
Like
