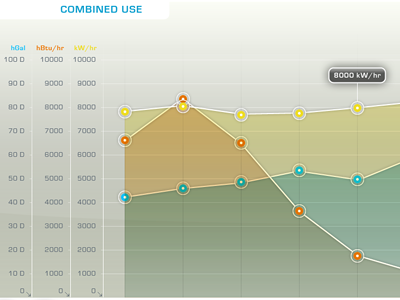
Automated Logic Graph
Working on a web version of a touch screen ap we created for Automated Logic that displays building energy usage. Each of the three overlapping metrics can be turned on and off independently.
More by Todd Zerger View profile
Like
