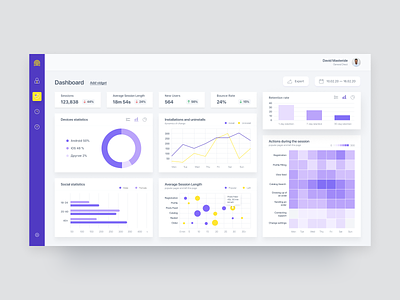
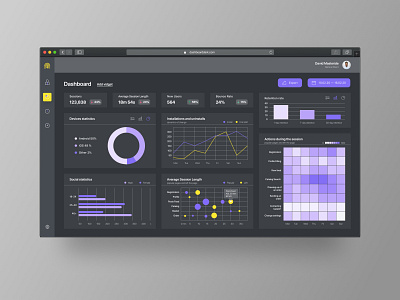
Dashboard of statistics data. Dark theme
Hello, players!)
The final assignment at #designspotschool both happily and sadly ended 3 months or so. I didn’t count how much, because it’s like delirious at 8 in the morning, up at 3 at night — to do it and have time ... and so maybe three weeks, or maybe the last month ... but it's cool when you understand That these endurance tests were not in vain! A lot of information, a lot of experience - sometimes I just wanted to yell))) like that beaver or gopher ..) oh well, I wanted to .. yelled))) but was it worth it, do you think? Thanks a lot for the DesignSpot_community!
And for your attention!
Be healthy!