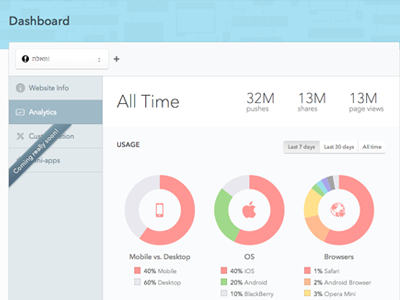
Trying to make numbers look interesting… Using the amazing Chart.js for fancy graph animations.
See attached full version to get a glimpse on the other statistics.
This is Brow.si and analytics are coming up really soon :)