3beards Visual History
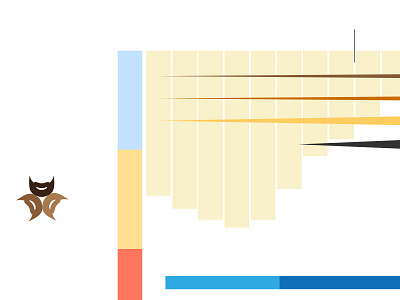

A visualisation of the 2 year period between May 2011 & May 2013. Each bar represents the average temperature in London for that month. Overlayed, triangles represent people, and squares represent our brands/events.
A visualisation of the 2 year period between May 2011 & May 2013. Each bar represents the average temperature in London for that month. Overlayed, triangles represent people, and squares represent our brands/events.