Table of Contents: Visualized
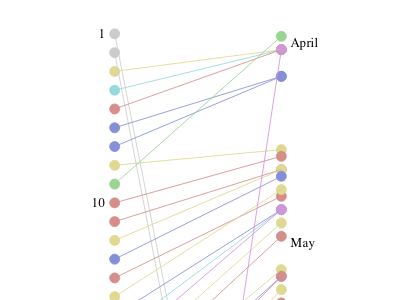
Now we’re getting to the neat stuff. Using d3.js to do a Tufte style slopegraph (parallel coordinate) visualization: chapter number on the left, date written on the right. Same color coordination by character as the Explore Mode table of contents.