Graphs in the CRM System
Hey, Dribbblers!👩🚀
I continue to fight for the beauty of the internal business system 🙄
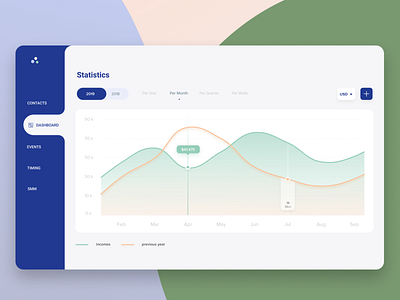
To compare income for two years with the ability to see it by month, you can use charts with different colors. When you hover and click, you can display the amount of income and a specific day of the month.
Everything ingenious is simple (?)
Probably only in design concepts 😅
Like & save 😋