1. Pies Pies Pies all other pies apple pie chef illustration menu pies pumpkin pie thanksgiving tiny chef
    View Pies Pies Pies
    Pies Pies Pies
    280
    57.7k
  2. Maze : Report Illustration 3d charts graph illustration pie chart report
    View Maze : Report Illustration
    Maze : Report Illustration
    393
    147k
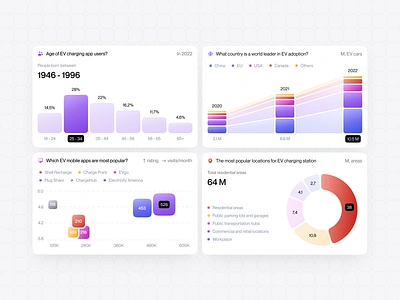
  3. Interviews and data | Charts and graphs | Analysis data bar chart bubble chart cards charts column chart comparison chart dashboard data doughnut gradient graph icons infographic interwiev numbers pie chart rating scatter chart stacked bar chart users
    1
    View Interviews and data | Charts and graphs | Analysis data
    Interviews and data | Charts and graphs | Analysis data
    621
    202k
  4. Maze : Report Illustration 3d charts graph illustration pie chart ui
    View Maze : Report Illustration
    Maze : Report Illustration
    459
    156k
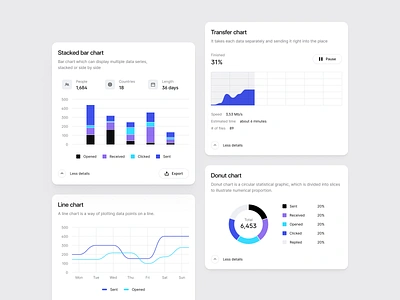
  5. Chart Sticker Sheet area bar chart charts clean color coding design system donut graphs grid histogram kpi legend line lines pie sticker sheet tokens transfer ui ux
    View Chart Sticker Sheet
    Chart Sticker Sheet
    597
    200k
  6. Ternary - Branding brand branding design finops logo pie chart scribbles
    View Ternary - Branding
    Ternary - Branding
    390
    123k
  7. #Exploration - Pitchdeck analytics bar card chart clean dashboard data deck doughnut graphs line pie pitchdeck point presentation slide stats ui web
    View #Exploration - Pitchdeck
    #Exploration - Pitchdeck
    1k
    378k
  8. Stat Cards bar bar chart card chart dashboard donut donut chart funnel graph indiana indianapolis innovatemap pie pie chart stat stat card statistics stats trend ui
    View Stat Cards
    Stat Cards
    258
    165k
  9. Infograms | IBM ampersandrew chart data datagrams grid infograms monoline pie radar radial scatter plot visualization volumetric
    View Infograms | IBM
    Infograms | IBM
    348
    177k
  10. DATA 3d c4d charts data data viz illustration infographic pie charts
    View DATA
    DATA
    347
    122k
  11. #Exploration - Dashboard bar chart clean dashboard data design desktop doughnut graphs line list pie product stats table ui ux website whitespace
    View #Exploration - Dashboard
    #Exploration - Dashboard
    976
    520k
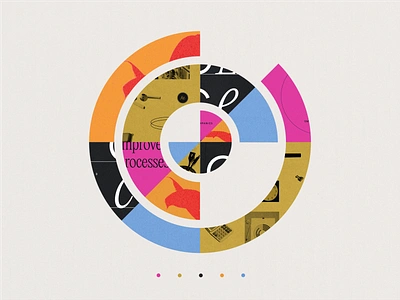
  12. Pie Chart Collage collage data vis data visualization graphic design pie chart
    View Pie Chart Collage
    Pie Chart Collage
    284
    79.6k
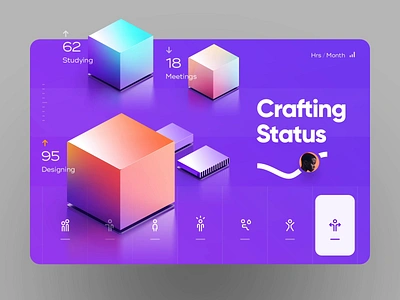
  13. Health Check 3d analytics app bars buildings chart data fitness gallery health numbers pie product work
    View Health Check
    Health Check
    2.7k
    522k
  14. šŸ Real Estate - Stats bar chart graph interior map pie chart property real estate statistics ui ux
    View šŸ Real Estate - Stats
    šŸ Real Estate - Stats
    1.5k
    355k
  15. Charts analytics bar chart charts column chart dashboard line chart pie chart polar chart stacked chart
    View Charts
    Charts
    112
    69.9k
  16. Chart Library - Free 90+ Charts UI KIT analytics chart chart library circular graph data data visualization donut chart figma free freebies graph pie chart pie graph saas statistics ui ui kit ux
    1
    View Chart Library - Free 90+ Charts UI KIT
    Chart Library - Free 90+ Charts UI KIT
    498
    145k
  17. TalkData - pie chart bird logo bird branding chart data diagram gradient infographic logo parrot pie chart talk
    View TalkData - pie chart bird logo
    TalkData - pie chart bird logo
    325
    225k
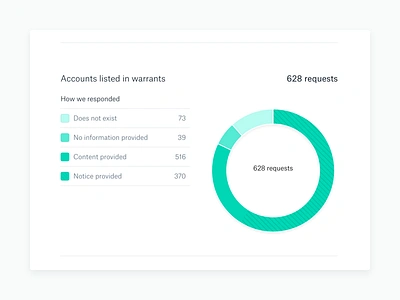
  18. Transparency - by request type donut chart infographic pie chart reports table web
    View Transparency - by request type
    Transparency - by request type
    333
    67.2k
  19. 3D Icons 3d animation blue bubble color dark laptop pie chart piechart pink red soft yellow
    View 3D Icons
    3D Icons
    368
    114k
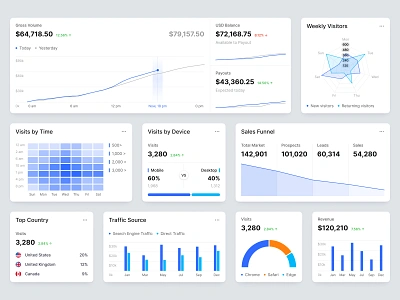
  20. Sales Components admin analytics bar chart chart dashboard design ecommerce funnel chart graph headtmap line chart pie chart radar chart reports saas sales statistics ui ux widget
    View Sales Components
    Sales Components
    1.2k
    374k
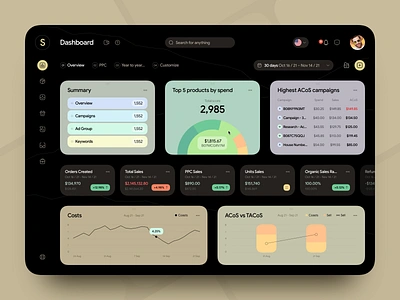
  21. Analytics Dashboard Design admin analytics chart dashboard data design fintech graph panel pie chart statistics stats ui ux web
    View Analytics Dashboard Design
    Analytics Dashboard Design
    2.4k
    650k
  22. Pie Charts šŸ“ app cards color dashboard data design graph pie charts ui uiux
    View Pie Charts šŸ“
    Pie Charts šŸ“
    538
    83.5k
  23. Secret WIP App analytics app bottom bar dark gradient graph iphone x percentage pie chart score timer
    View Secret WIP App
    Secret WIP App
    592
    146k
  24. Grant management software | Grant tracking | Analysis dashboard ai analysis cards charts colors dark mode dashboard finance grant graph indicators layout logo management overview pie chart product design saas sankey table
    View Grant management software | Grant tracking | Analysis dashboard
    Grant management software | Grant tracking | Analysis dashboard
    762
    202k
Loading moreā€¦