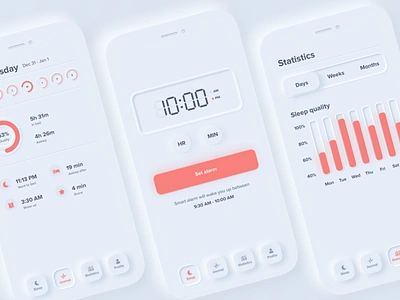
1. Sleep Cycle App - Neumorphism Redesign 2020 trends activity analytics clock color theory concept design data graph menu mobile navigation neumorphism overview profile skeuomorph app skeuomorphism sleep tracker statistics tracker typogaphy
    View Sleep Cycle App - Neumorphism Redesign
    Sleep Cycle App - Neumorphism Redesign
    1.1k
    290k
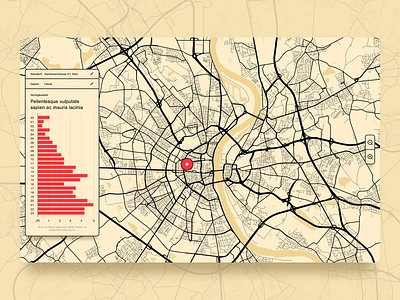
  2. Mapstyle for Datavisualisation project bar chart barchart city data datavisualisation datavisualization dataviz map mapbox statistics style typography
    View Mapstyle for Datavisualisation project
    Mapstyle for Datavisualisation project
    526
    94k
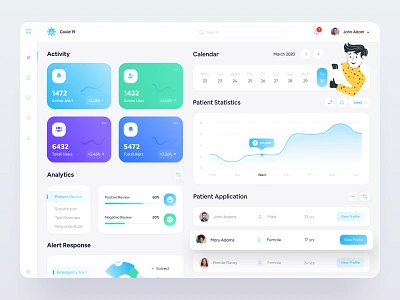
  3. Covid-19 Dashboard for Admin admin dashboard chart civid 19 clean design covid19 dashboard app dashboard template dashboard ui health homepage hospital hospital dashboard landingpage medical minimal design statistics typography user experience webapp design
    View Covid-19 Dashboard for Admin
    Covid-19 Dashboard for Admin
    689
    208k
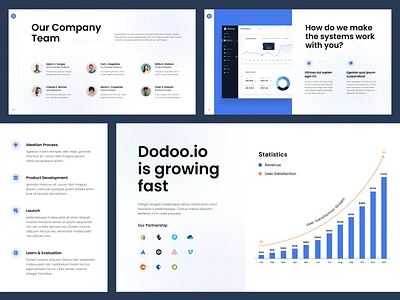
  4. TV Advertising Platform Landing Page analytics data purple statistics tech tv typography
    View TV Advertising Platform Landing Page
    TV Advertising Platform Landing Page
    760
    57.5k
  5. Just A Playful Dasboard analytics cards clean colour components dashboard dashboard ui data design guide illustration landing page library minimal pastel pattern playful saas statistics task management typogaphy
    View Just A Playful Dasboard
    Just A Playful Dasboard
    70
    28k
  6. Data Viz: Area Chart analytics area chart chart dashboard data data analysis data analytics datavisualisation datavisualization design editorial design graph illustration magazine statistic statistics stats typography visualisation visualization
    View Data Viz: Area Chart
    Data Viz: Area Chart
    47
    10.6k
  7. Financial Dashboard animation calendar crypto design economy finance flat illustration laptop money motion statistics title typography vector
    View Financial Dashboard
    Financial Dashboard
    86
    15.9k
  8. Data Viz: Strip Plot analytics chart dashboard data vis data visualisation data visualization datavisualization dataviz editorial design graph statistic statistics stats strip plot typography visualisation visualization
    View Data Viz: Strip Plot
    Data Viz: Strip Plot
    34
    11.5k
  9. City of Finance animation chart city data design economy finance flat illustration landscape motion report skyscraper statistics title typography vector
    View City of Finance
    City of Finance
    64
    17.6k
  10. #Exploration - Pitch Deck Design clean deck exploration layout pitch pitch deck presentation slides statistics typography
    View #Exploration - Pitch Deck Design
    #Exploration - Pitch Deck Design
    358
    116k
  11. RW Academy Emblem For Data Analytics academy arm design flat graph illustration learn product management statistics stats typography vector youtube
    View RW Academy Emblem For Data Analytics
    RW Academy Emblem For Data Analytics
    38
    14k
  12. RW Academy Emblem For Spreadsheets academy arm design flat graph illustration learn product management statistics stats typography vector youtube
    1
    View RW Academy Emblem For Spreadsheets
    RW Academy Emblem For Spreadsheets
    31
    12.3k
  13. Profitero Top Brands on Amazon Infographic Wireframe data ecommerce infographic layout numbers statistics typography
    View Profitero Top Brands on Amazon Infographic Wireframe
    Profitero Top Brands on Amazon Infographic Wireframe
    39
    9.3k
  14. Financial Management App - UI Concept appuidesign appuiux design designideas financial icon illustration income management minimal mobile mobile app design statistics typography
    View Financial Management App - UI Concept
    Financial Management App - UI Concept
    96
    9.7k
  15. Statistics by Country art direction clean grid layout motion motion graphics simple typography
    View Statistics by Country
    Statistics by Country
    95
    18.9k
  16. Analytics for Innovation Summit analytics chart dashboard data demographics design graphs minimal statistics podcast statistics typography
    View Analytics for Innovation Summit
    Analytics for Innovation Summit
    27
    5.8k
  17. Top Brands on Amazon Layout Process data ecommerce infographic layout numbers statistics typography
    View Top Brands on Amazon Layout Process
    Top Brands on Amazon Layout Process
    30
    10k
  18. 2018 Font Purchasing Habits Survey: Gender data figs fonts gender statistics stats survey type
    1
    View 2018 Font Purchasing Habits Survey: Gender
    2018 Font Purchasing Habits Survey: Gender
    36
    4.2k
  19. Web App Statistics blue chart data graph green helvetica orange pictos proxima nova soft statistics
    View Web App Statistics
    Web App Statistics
    624
    35.4k
  20. Responses from 119 countries data figs fonts map statistics stats survey type world
    View Responses from 119 countries
    Responses from 119 countries
    24
    3.6k
  21. Financial Graph chart data design finance financial flat graph graphic design illustration statistics title typography vector
    View Financial Graph
    Financial Graph
    28
    17.2k
  22. Category icons checkmark gallery graph icon megaphone pic rate rating star statistics stats text
    View Category icons
    Category icons
    26
    6.2k
  23. Profitero Top Brands on Amazon Infographic data ecommerce infographic layout numbers statistics typography
    1
    View Profitero Top Brands on Amazon Infographic
    Profitero Top Brands on Amazon Infographic
    25
    5k
  24. 2018 Font Purchasing Habits Survey - Graphic Designers data figs fonts graphic design statistics stats survey type
    1
    View 2018 Font Purchasing Habits Survey - Graphic Designers
    2018 Font Purchasing Habits Survey - Graphic Designers
    19
    2.8k
Loading more…