1. Interviews and data | Charts and graphs | Analysis data bar chart bubble chart cards charts column chart comparison chart dashboard data doughnut gradient graph icons infographic interwiev numbers pie chart rating scatter chart stacked bar chart users
    1
    View Interviews and data | Charts and graphs | Analysis data
    Interviews and data | Charts and graphs | Analysis data
    621
    201k
  2. Chart Sticker Sheet area bar chart charts clean color coding design system donut graphs grid histogram kpi legend line lines pie sticker sheet tokens transfer ui ux
    View Chart Sticker Sheet
    Chart Sticker Sheet
    597
    200k
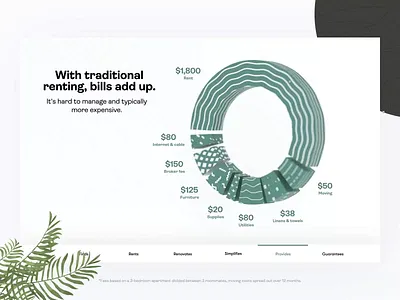
  3. #Exploration - Pitchdeck analytics bar card chart clean dashboard data deck doughnut graphs line pie pitchdeck point presentation slide stats ui web
    View #Exploration - Pitchdeck
    #Exploration - Pitchdeck
    1k
    378k
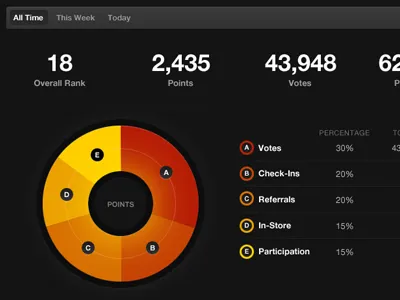
  4. Stat Cards bar bar chart card chart dashboard donut donut chart funnel graph indiana indianapolis innovatemap pie pie chart stat stat card statistics stats trend ui
    View Stat Cards
    Stat Cards
    258
    165k
  5. #Exploration - Dashboard bar chart clean dashboard data design desktop doughnut graphs line list pie product stats table ui ux website whitespace
    View #Exploration - Dashboard
    #Exploration - Dashboard
    976
    520k
  6. šŸ Real Estate - Stats bar chart graph interior map pie chart property real estate statistics ui ux
    View šŸ Real Estate - Stats
    šŸ Real Estate - Stats
    1.5k
    355k
  7. Chart Library - Free 90+ Charts UI KIT analytics chart chart library circular graph data data visualization donut chart figma free freebies graph pie chart pie graph saas statistics ui ui kit ux
    1
    View Chart Library - Free 90+ Charts UI KIT
    Chart Library - Free 90+ Charts UI KIT
    496
    145k
  8. Charts analytics bar chart charts column chart dashboard line chart pie chart polar chart stacked chart
    View Charts
    Charts
    112
    69.9k
  9. Sales Components admin analytics bar chart chart dashboard design ecommerce funnel chart graph headtmap line chart pie chart radar chart reports saas sales statistics ui ux widget
    View Sales Components
    Sales Components
    1.2k
    374k
  10. Analytics Dashboard Design admin analytics chart dashboard data design fintech graph panel pie chart statistics stats ui ux web
    View Analytics Dashboard Design
    Analytics Dashboard Design
    2.4k
    650k
  11. Grant management software | Grant tracking | Analysis dashboard ai analysis cards charts colors dark mode dashboard finance grant graph indicators layout logo management overview pie chart product design saas sankey table
    View Grant management software | Grant tracking | Analysis dashboard
    Grant management software | Grant tracking | Analysis dashboard
    762
    201k
  12. The Know - Hotel Dashboard chart dashboard graph infographic interface lines pie piechart ui ux
    View The Know - Hotel Dashboard
    The Know - Hotel Dashboard
    229
    52.4k
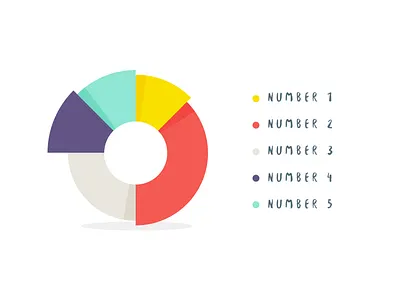
  13. Universal Data Visualization | Pie Chart 123done analytics chart charts dashboard data data visualization dataviz figma infographic pie chart template ui universal data visualization widgets
    View Universal Data Visualization | Pie Chart
    Universal Data Visualization | Pie Chart
    313
    187k
  14. Charts bar chart dashboard line pie toggle
    View Charts
    Charts
    146
    40.5k
  15. Conceptual Dashboard UI analytics bars chart dashboard flat graph pie stats
    View Conceptual Dashboard UI
    Conceptual Dashboard UI
    150
    29.1k
  16. NEW PRODUCT āœ¦ Hyper charts UI Kit 3d chart analytics bar chart chart circle chart components dashboard data dataviz desktop heatmap infographic line chart neon pie chart sankey statistic template ui widgets
    View NEW PRODUCT āœ¦ Hyper charts UI Kit
    NEW PRODUCT āœ¦ Hyper charts UI Kit
    320
    98.4k
  17. Content Based Dashboard chart data design gauge pie chart saas ui ux visualization
    View Content Based Dashboard
    Content Based Dashboard
    184
    86.7k
  18. #Exploration - Financial Dashboard bar chart cards charts clean dark mode dashboard data doughnut chart financial illustrations layout line chart list pie chart stats thumbnail transaction ui ux whitespace
    View #Exploration - Financial Dashboard
    #Exploration - Financial Dashboard
    265
    104k
  19. Datasoft Dashboard Charts bar chart charts column chart curve chart dashboard flow chart line chart pie chart radar chart stacked bar chart
    View Datasoft Dashboard Charts
    Datasoft Dashboard Charts
    227
    64.9k
  20. Some Analytics analytics bars chart dashboard flat graph pie stats
    1
    View Some Analytics
    Some Analytics
    631
    36.9k
  21. Widgets and all kinds of graphics for analytical data 3d analytics bubble chart chart circle chart column chart components dashboard dataviz design desktop figma infographic library line chart pie chart sankey statistic template ui
    View Widgets and all kinds of graphics for analytical data
    Widgets and all kinds of graphics for analytical data
    188
    118k
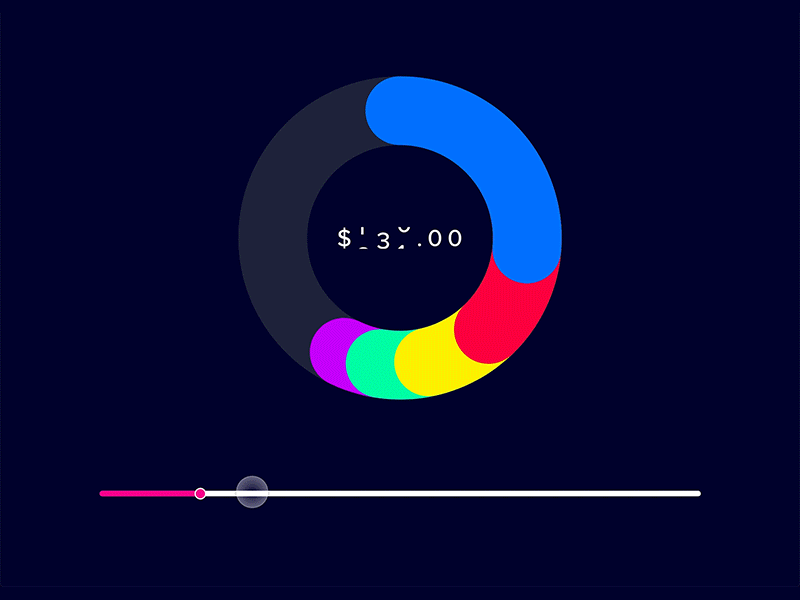
  22. Pie Chart Concept colorful cpu dashboad dashboard design dashboard ui disk graphic kpi memory meter metrics monitor monitoring dashboard pie chart piechart rainbow ram ui ui ux usage
    1
    View Pie Chart Concept
    Pie Chart Concept
    218
    92.6k
  23. Admin dashboard: analytics UX admin dashboard analytics chart crm dashboard dashboard design data detail graph management pie chart product product design shop statistics stats uxdesign
    1
    View Admin dashboard: analytics UX
    Admin dashboard: analytics UX
    1.1k
    512k
  24. Stock App Dashboard chart commerce dashboard desktop graph icons material pie shop stats stocks web
    1
    View Stock App Dashboard
    Stock App Dashboard
    2.6k
    325k
Loading moreā€¦