1. Bayesian Probability branding charts gradient graphs identity logo logo mark probability sales
    1
    View Bayesian Probability
    Bayesian Probability
    254
    13.1k
  2. Graph Curves branding charts gradient graphs identity logo logo mark probability sales
    View Graph Curves
    Graph Curves
    177
    11.8k
  3. Analyze This aggregation analytics big data charts data geometric graphs hexagon logo mark shadow
    View Analyze This
    Analyze This
    134
    30.5k
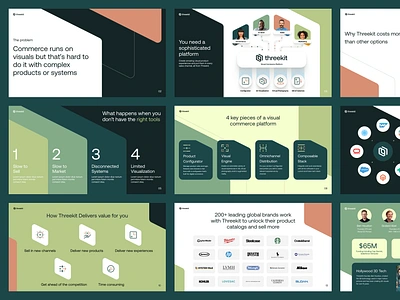
  4. B2B Pitch Deck b2b brand brand design brand designer brand identity branding chart funding google slides graphs iconography icons keynote modern pitch deck ppt saas shapes slides tech
    View B2B Pitch Deck
    B2B Pitch Deck
    291
    103k
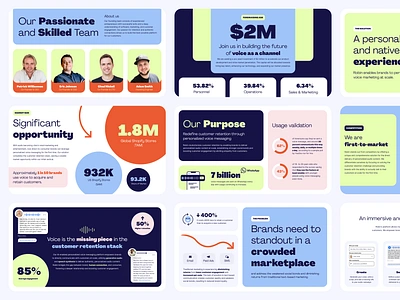
  5. Pitch Deck brand branding data data visuals funding funding deck google slides graphic design graphs icon keynote modern numbers pitch pitch deck powerpoint presentation sales sales deck slides
    View Pitch Deck
    Pitch Deck
    309
    84.7k
  6. Server software monitoring system logo design symbol client cloud applications connections stats statistics digital information technology electronic web performance tools flat 2d geometric graphs charts logs entries it server software logo logo design network networking online data apps security monitoring system vector icon mark symbol
    2
    View Server software monitoring system logo design symbol
    Server software monitoring system logo design symbol
    184
    76.5k
  7. PowerPing server software monitoring system logo design branding client cloud applications connections stats statistics digital information technology electronic web performance tools flat 2d geometric graphs charts logs entries identity design it server software logo logo design network networking online data apps security monitoring system vector icon mark symbol
    View PowerPing server software monitoring system logo design
    PowerPing server software monitoring system logo design
    147
    77.8k
  8. Drink by Numbers analytics data droplet geometric gestalt graphs logo mark pie charts spirits wine
    View Drink by Numbers
    Drink by Numbers
    191
    31.5k
  9. PowerPing, P letter mark for server monitoring software client cloud applications connections stats statistics digital information technology electronic web performance tools flat 2d geometric graphs charts logs entries it server software letter mark monogram logo design online data apps p portal portals security monitoring system vector icon mark symbol
    View PowerPing, P letter mark for server monitoring software
    PowerPing, P letter mark for server monitoring software
    168
    91.7k
  10. Analyzing social media performance analytics brand buffer character character illustration chart customer dots graphs illustration map metrics numbers people performance sales social media social media marketing
    View Analyzing social media performance
    Analyzing social media performance
    47
    24.4k
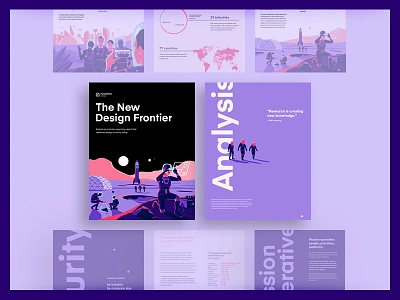
  11. InVision - New Design Frontier PDF brand clean color graphs illustration infographic pdf print report type
    View InVision - New Design Frontier PDF
    InVision - New Design Frontier PDF
    638
    145k
  12. Infographix annual report branding color design focus lab graphs infographics
    View Infographix
    Infographix
    188
    42.9k
  13. Icons analytics branding data focus lab graphs icons illustration
    View Icons
    Icons
    170
    7.2k
  14. Quantum Fintech – Logo Design bell bells brandforma branding chart design finance fintech gradient graphic design graphs grid logo logotype mark multiply overlap overlay quantum transparent
    View Quantum Fintech – Logo Design
    Quantum Fintech – Logo Design
    79
    22.6k
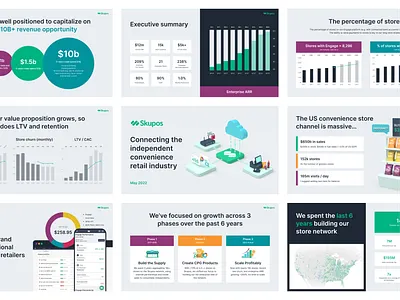
  15. Skupos Pitch Deck branding data deck funding graphs pitch pitch deck powerpoint ppt sales series c slide slides
    View Skupos Pitch Deck
    Skupos Pitch Deck
    106
    66.2k
  16. G monograms charts g geometric graphs growth logo monogram typography
    View G monograms
    G monograms
    72
    16.7k
  17. Worktime Charting the Threshold alerts barrier brand business charts energy good time to buy graphs illustration isometric minimal threshold vector zero state
    View Worktime Charting the Threshold
    Worktime Charting the Threshold
    41
    25k
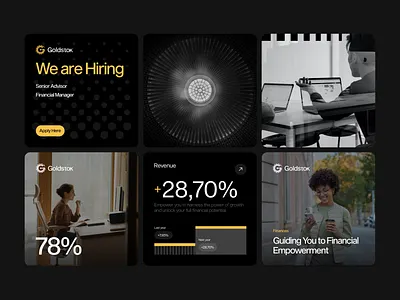
  18. Goldstok © — Visual Identity branding chart design elements finance fintech gold graphs illustration invest logo minimal percent saving stock ui visual wallet yellow
    View Goldstok © — Visual Identity
    Goldstok © — Visual Identity
    48
    8.5k
  19. vibes trading arrow business download finacial finance graphs invest investing investment job logo minimal monogram trade trading up
    View vibes trading
    vibes trading
    105
    40.1k
  20. Graphs & Diagrams branding charts diagrams graphic design
    View Graphs & Diagrams
    Graphs & Diagrams
    19
    6.5k
  21. cashmetrics bars c graphs logo mark metrics
    View cashmetrics
    cashmetrics
    55
    3.4k
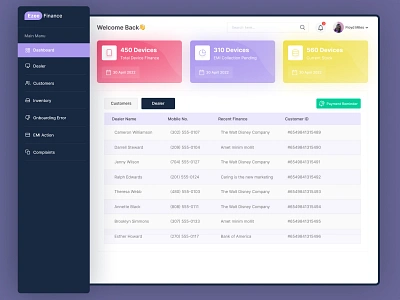
  22. Finance Admin Dashboard admin admin panel admin theme analytics banking branding clean concept dashboard design design emi finance financial services graphs management tool statistics transactions ui user dashboard ux ui design
    View Finance Admin Dashboard
    Finance Admin Dashboard
    59
    8.4k
  23. TOP NINE 2020 branding consulting people orbit saturn ff finance flow graphs graphic f loop infinite logo design planet team monogram play fire s space hello calendar booking tt b speed p
    View TOP NINE 2020
    TOP NINE 2020
    404
    173k
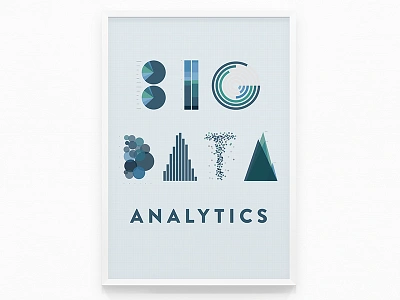
  24. Big Data Analytics Poster big data charts data data visualizations graphs illustration logo poster
    View Big Data Analytics Poster
    Big Data Analytics Poster
    27
    5.6k
Loading more…