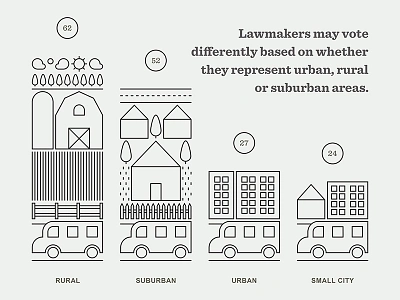
1. Bar Graph for Education Article bar graph education funding government infograph infographic information design linear linework monoline publication
    View Bar Graph for Education Article
    Bar Graph for Education Article
    44
    8k
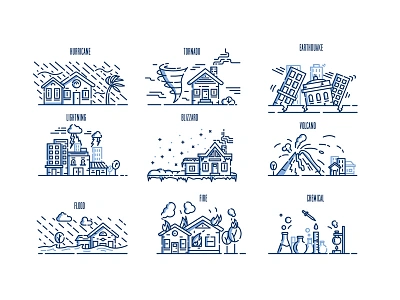
  2. Emergency & Disaster Illustrations color debut disaster emergency illustration infograph infographic line linework stroke stylized
    1
    View Emergency & Disaster Illustrations
    Emergency & Disaster Illustrations
    214
    16.9k
  3. Cookies Dribbble bake cookies diagram icon illustration infograph information layout numbers sweet user
    View Cookies Dribbble
    Cookies Dribbble
    96
    8.5k
  4. Coffee Nerd chart coffee flower graph illustration infograph leaf milwaukee plant poster vector
    1
    View Coffee Nerd
    Coffee Nerd
    106
    9.4k
  5. Infograph flat illustrator infographic
    View Infograph
    Infograph
    19
    3.3k
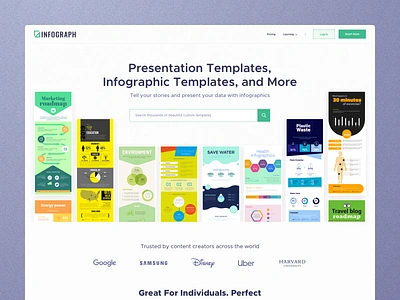
  6. Infograph - Infographics Landing Page Design best branding clean design illustration interface interfaces landing minimal ui ux web web design webdesign website
    View Infograph - Infographics Landing Page Design
    Infograph - Infographics Landing Page Design
    81
    21.2k
  7. Syrian Crisis Web Timeline app crisis data datavis gif infograph infographic syria timeline web
    View Syrian Crisis Web Timeline
    Syrian Crisis Web Timeline
    32
    13.5k
  8. Visual Design chart infograph ui ux visual design
    View Visual Design
    Visual Design
    29
    3.9k
  9. Graph Widget circle data graph info infograph infographic ui user interface
    View Graph Widget
    Graph Widget
    455
    23.7k
  10. CMC Infograph #2 — Actionable Insights! actionable artificial cloud console data ibm infograph insights intelligence lowden management robots
    View CMC Infograph #2 — Actionable Insights!
    CMC Infograph #2 — Actionable Insights!
    76
    22.6k
  11. Making Internal Charts Fun chart circles dots infograph infographic lines process timeline
    View Making Internal Charts Fun
    Making Internal Charts Fun
    347
    25.2k
  12. Perfect Equation brewing cafe coffee cup design drop icon illustration infograph minimalistic
    View Perfect Equation
    Perfect Equation
    106
    17.9k
  13. lost phone infographic chart data icons infograph infographic infographics paper phone
    View lost phone infographic
    lost phone infographic
    96
    7.2k
  14. Animated Total Miles Chart animation chart d3js dataviz infograph javascript motion
    View Animated Total Miles Chart
    Animated Total Miles Chart
    26
    6.8k
  15. Infograph in progress infographics
    View Infograph in progress
    Infograph in progress
    23
    2.3k
  16. Graph data visualization anim animation data visualization design gif graph graphic design illustration infograph
    View Graph data visualization
    Graph data visualization
    32
    7.6k
  17. #FunFact computer fact fun gradient infograph old statistic technology website
    View #FunFact
    #FunFact
    32
    8.5k
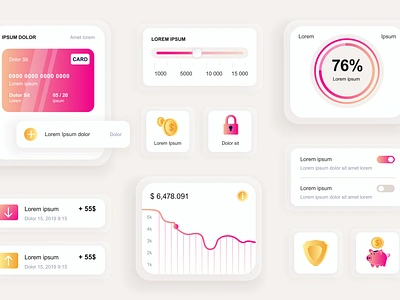
  18. Bankign Mobile App Elements Ui Kit app application bank banking elements gui infograph infographic interface kit mobile mockup modern responsive screen template ui unique user ux
    View Bankign Mobile App Elements Ui Kit
    Bankign Mobile App Elements Ui Kit
    128
    45.8k
  19. Dashboard Animations animation dashboard din gif health infograph medicine proxima ui ux web
    View Dashboard Animations
    Dashboard Animations
    317
    16.3k
  20. Turnit flow header illustrations infograph process steps web
    View Turnit
    Turnit
    49
    13.1k
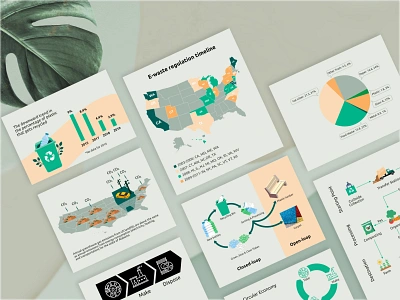
  21. Rethink the Bins data visualization ebook environment global worming graphic design green tech iformation infograph infographic print design publication recycle waste waste management
    View Rethink the Bins
    Rethink the Bins
    39
    20.3k
  22. Infographic Bitcoin Benefits 2018 a3 altcoing bitcoin design download infograph infographic poster vector
    View Infographic Bitcoin Benefits 2018
    Infographic Bitcoin Benefits 2018
    22
    9.8k
  23. One Year Of Running angularjs d3js dataviz infograph javascript
    View One Year Of Running
    One Year Of Running
    42
    6.2k
  24. Reports and statistics app design digital icon illustration infograph reports statistics
    View Reports and statistics
    Reports and statistics
    17
    5.7k
Loading more…