1. Weekly users growth analytics arrows dashboard graphs users
    View Weekly users growth
    Weekly users growth
    9
    481
  2. Where u Clickin? analytics charts pie stats
    View Where u Clickin?
    Where u Clickin?
    13
    722
  3. Visualizr analytics dashboard data information interface monitoring visualization visualizr
    View Visualizr
    Visualizr
    14
    1.3k
  4. Layout For Analytic System analytics dashboard finances layout ui ux wireframe
    View Layout For Analytic System
    Layout For Analytic System
    29
    2.5k
  5. Analytiks V2 Graph analytics app google infographics iphone minimal stats
    View Analytiks V2 Graph
    Analytiks V2 Graph
    40
    1.7k
  6. Calculating Customer Lifetime Value (infographic) analytics chart clean dashboard data data visualization diagram finance graph graphic helvetica how to infographic infographics interface kissmetrics lifetime value line line chart ltv marketing money purchase purchase cycle ui ux visualization
    View Calculating Customer Lifetime Value (infographic)
    Calculating Customer Lifetime Value (infographic)
    69
    7.8k
  7. Analytics dashboard analytics dashboard ui
    View Analytics dashboard
    Analytics dashboard
    29
    1.6k
  8. CSS Analytics analytics api bar chart chart cms css3 dashboard dashboard analytics google graph progress statistics stats transient wordpress
    View CSS Analytics
    CSS Analytics
    39
    3.6k
  9. Analytics, Reports & things... analytics bar dashboard graphs icons interface reports ui web
    View Analytics, Reports & things...
    Analytics, Reports & things...
    158
    9.2k
  10. CloudFlare Analytics analytics chart dashboard data graph visualization web app website
    View CloudFlare Analytics
    CloudFlare Analytics
    129
    9.9k
  11. Analytics App Chart Tooltip UI Elements analytics arrows blue button chart clean dashboard dial icon interface modal overlay popup red soft texture tooltip ui ux web white
    View Analytics App Chart Tooltip UI Elements
    Analytics App Chart Tooltip UI Elements
    655
    60.3k
  12. Internal Analytics / Dashboard analytics circle counter dashboard data ui
    View Internal Analytics / Dashboard
    Internal Analytics / Dashboard
    369
    19.3k
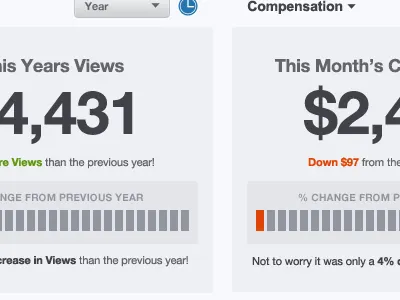
  13. Big numbers chart dashboard graph grey
    View Big numbers
    Big numbers
    37
    1.6k
  14. Spahkline Bah Chaht dribbble grey helvetica pro sparkline stats
    View Spahkline Bah Chaht
    Spahkline Bah Chaht
    896
    37.1k
  15. Infographic chart data data viz graph sales
    View Infographic
    Infographic
    572
    34.2k
  16. Interactive Data Viz art direction concept creative direction data viz design html5 info graphic rally interactive ui
    View Interactive Data Viz
    Interactive Data Viz
    342
    16.1k
  17. You want some tooltips? chartbeat concurrents data viz tooltip
    View You want some tooltips?
    You want some tooltips?
    20
    2.3k
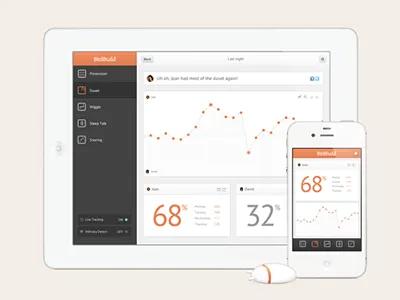
  18. BedBudd app bedbudd fireworks ipad iphone
    View BedBudd
    BedBudd
    397
    12.7k
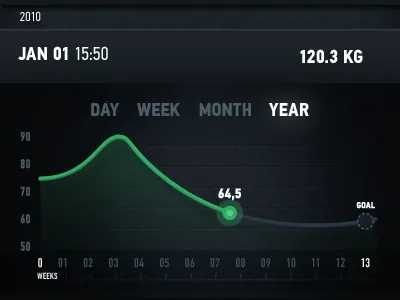
  19. Gipis Profile Weight app gipis graph ios ui
    View Gipis Profile Weight
    Gipis Profile Weight
    204
    5.8k
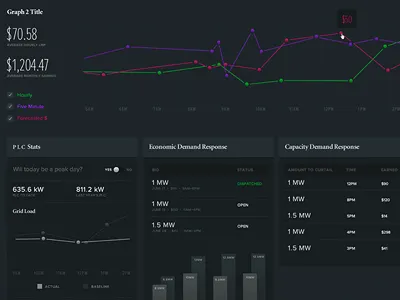
  20. Energy
    View Energy
    Energy
    122
    4.6k
  21. Dark UI
    View Dark UI
    Dark UI
    267
    7.4k
  22. Dashboard Performance app buttons dashboard dropdown graphs line chart pie chart ui ux webapp
    View Dashboard Performance
    Dashboard Performance
    238
    16.6k
  23. Time & Travel diagram geography gotham history infographic life map personal red sepia travel typography white
    View Time & Travel
    Time & Travel
    85
    4.3k
  24. Reports screen analytics helvetica stuffbuff
    View Reports screen
    Reports screen
    174
    6.2k
Loading more…