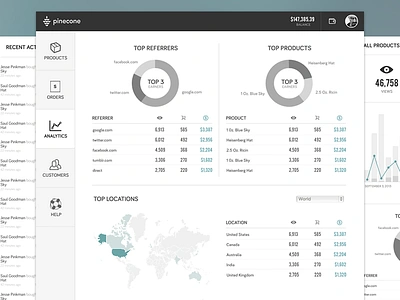
1. Stats Exploration analytics chart dashboard data graph product statistics stats ui
    View Stats Exploration
    Stats Exploration
    1.6k
    112k
  2. Dashboard Web App Product UI Design: Job Summary analytics dashboard data form graph grid interface metrics mobile navigation product visualization
    3
    View Dashboard Web App Product UI Design: Job Summary
    Dashboard Web App Product UI Design: Job Summary
    5.6k
    700k
  3. Statistics data chart analytics chart dashboard data gif graph material stats
    View Statistics data chart
    Statistics data chart
    53
    6.8k
  4. The horse race bar chart chartbeat data ui
    View The horse race
    The horse race
    19
    1.6k
  5. Live Dashboards animation charts dashboard data graph icon illustration microsoft power bi ui visualizations
    View Live Dashboards
    Live Dashboards
    444
    53k
  6. Power BI Visual Event animation bi data visualization graph interaction microsoft motion power bi ui ux
    View Power BI Visual Event
    Power BI Visual Event
    297
    34.6k
  7. Pinecone Wireframes analytics dashboard data layout process progress sketch stats ui ux visualization wireframes
    View Pinecone Wireframes
    Pinecone Wireframes
    176
    18.7k
  8. ReportsUI app betraydan clean data design graph minimal rebound reports sketch ui
    View ReportsUI
    ReportsUI
    810
    38.1k
  9. Analytics Landing Page chart clean dashboard data design graph home page landing page modern ui ux website
    2
    View Analytics Landing Page
    Analytics Landing Page
    2.3k
    209k
  10. Tapdaq - Creative Template Process animation apps dashboard gif graph performance profile stats summary table ui web
    View Tapdaq - Creative Template Process
    Tapdaq - Creative Template Process
    706
    84.2k
  11. Survey Charts Control
    View Survey Charts Control
    Survey Charts Control
    302
    28.2k
  12. Dashboard Obscura app buttons dashboard data infographic interface menu nav navigation timeline ui visualization
    View Dashboard Obscura
    Dashboard Obscura
    170
    9.9k
  13. #1 app button calendar dashboard flat notification people ui ux web
    View #1
    #1
    425
    24.8k
  14. Graph chart dashboard data design glow graph interface kit statistics stats ui
    3
    View Graph
    Graph
    1.7k
    158k
  15. Analytics App Navigation [Jiffy Gif] analytics app bigdata bootstrap d3 dashboard flat gif icomoon nopsd ui ux
    View Analytics App Navigation [Jiffy Gif]
    Analytics App Navigation [Jiffy Gif]
    33
    2.8k
  16. Campaign Analytics analytics application charts colors dashboard graphs metrics navigation social trend webapp website
    View Campaign Analytics
    Campaign Analytics
    59
    4.7k
  17. Performance Dashboard analytics charts dark dashboard graphs open sans sparkline widgets
    1
    View Performance Dashboard
    Performance Dashboard
    2.1k
    209k
  18. Content Details analytics application bar chart data donut flat graph ui visualization
    View Content Details
    Content Details
    21
    3k
  19. I don't know how to call this screen. blue data dropdown graph percents popup stats ui
    View I don't know how to call this screen.
    I don't know how to call this screen.
    52
    3.5k
  20. Big Data webinar graphic bar graph big data color palette facebook green infographic muted nerdery pie chart retro webinar yellow
    View Big Data webinar graphic
    Big Data webinar graphic
    21
    3.7k
  21. Social Stats Module facebook flat module muted social statistics stats
    View Social Stats Module
    Social Stats Module
    86
    3.3k
  22. BMI bar chart bmi chart data health line chart medical scale
    View BMI
    BMI
    116
    12.4k
  23. Simple Stats chart data graph info medium numbers stats ui
    View Simple Stats
    Simple Stats
    2.7k
    162k
  24. 3d chart 3d app chart dashboard diagram diagramm graph illustration infographic photoshop statistics ui web
    View 3d chart
    3d chart
    1.2k
    101k
Loading more…