1. Line Graph {gif} 2d after effects animation graph motion graphics
    View Line Graph {gif}
    Line Graph {gif}
    534
    34.6k
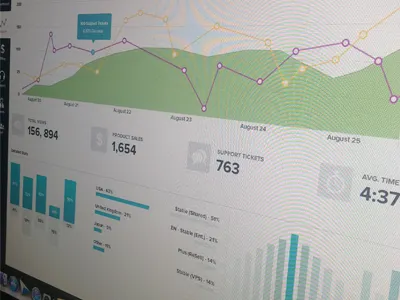
  2. Analytics, Reports & things... analytics bar dashboard graphs icons interface reports ui web
    View Analytics, Reports & things...
    Analytics, Reports & things...
    158
    9.2k
  3. Ui Kit blue circle clean contact form fields filter green info interface ios kit light login modern new orange popup profile red search sharp shopping cart sign in slider store style ui ux web yellow
    View Ui Kit
    Ui Kit
    123
    19.5k
  4. Dashboard Full 2 analytics app button clear dashboard date designer drop down duration graph grey gui icon index menubar minimalist navigation profile sidebar stat statistic store timeline ui ux web white
    1
    View Dashboard Full 2
    Dashboard Full 2
    920
    125k
  5. Website Analytics Dashboard analytics app application chart clean dashboard data visualization design ecommerce flat graphs interface pie stats ui user interface design
    View Website Analytics Dashboard
    Website Analytics Dashboard
    451
    47.5k
  6. Facebook: America Votes 2012 animation data desktop facebook fullscreen info graphic infographic interactive map mobile real time responsive svg visualization vote voters voting
    View Facebook: America Votes 2012
    Facebook: America Votes 2012
    559
    53k
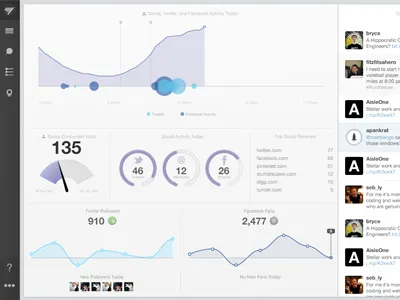
  7. It's about to get social analytics dashboard data data visualization events social social analytics stream visualization
    View It's about to get social
    It's about to get social
    1.1k
    92.9k
  8. One last thing awesomesauce chart colors dashboard fitbit graph poster print
    View One last thing
    One last thing
    1.5k
    113k
  9. Infographic Postcard data graph helvetica icons infographic visualization
    View Infographic Postcard
    Infographic Postcard
    1.4k
    95.9k
  10. Timeline UX Legend app application data visualization design icons infographics ux web design
    View Timeline UX Legend
    Timeline UX Legend
    138
    11.9k
  11. Dashboard dashboard data full width grey helvetica interface minimal neu panel source sans visualization white
    1
    View Dashboard
    Dashboard
    142
    7.9k
  12. Stream analytics app bar charts clear data event graph minimalist simple stamp stream time timeline ui ux visualization web
    View Stream
    Stream
    159
    16.8k
  13. Wireframe data stats visualization wireframe
    View Wireframe
    Wireframe
    146
    4.9k
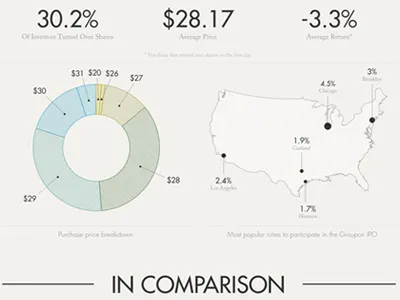
  14. Groupon Infographic chart data donut graph graphic infographic information information graphic map pie stats visualization
    View Groupon Infographic
    Groupon Infographic
    182
    13.1k
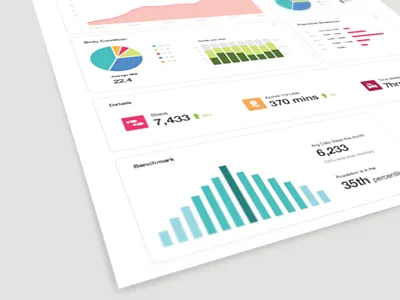
  15. Details circle progress bar dashboard data progress bar stats visualization
    View Details
    Details
    194
    13.8k
  16. FREEBIE Resume redesign. cv free freebie resume
    1
    View FREEBIE Resume redesign.
    FREEBIE Resume redesign.
    981
    86.1k
  17. Resume finished bars charts cv graphs print resume
    View Resume finished
    Resume finished
    540
    65.5k
Loading more…