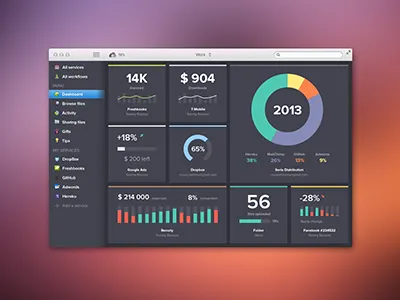
1. Graphic app graph graphic mobile statistics
    View Graphic
    Graphic
    209
    5.9k
  2. Thanks, Chris! chart graph infographic
    View Thanks, Chris!
    Thanks, Chris!
    25
    455
  3. easySales app UI graphic info ios sales ui ux
    View easySales app UI
    easySales app UI
    35
    1.1k
  4. Chart chart
    View Chart
    Chart
    13
    894
  5. Sush.io Mac App (Full view) app store charts graph icons mac app nav osx stats ui
    1
    View Sush.io Mac App (Full view)
    Sush.io Mac App (Full view)
    1.1k
    77.1k
  6. Dashboard charts dashboard finance financial dashboard graph money transaction dashboard ui user interface
    View Dashboard
    Dashboard
    93
    9.1k
  7. Weather Application mocking… weather weatheroo
    View Weather Application mocking…
    Weather Application mocking…
    12
    461
  8. Dashboard Graph chart clean dashboard flat graph minimal simple statistics stats ui user interface widget
    View Dashboard Graph
    Dashboard Graph
    52
    3.6k
  9. Potential Twitter Archive Interface archive data download tweets twitter
    View Potential Twitter Archive Interface
    Potential Twitter Archive Interface
    63
    3.4k
  10. Info + Graphics clean design infographics interactive minimal web design
    View Info + Graphics
    Info + Graphics
    287
    13.6k
  11. Strength in Motion App app black bondi exercise fitness iphone smart phone strength sydney yellow
    View Strength in Motion App
    Strength in Motion App
    21
    1.2k
  12. Rep graph popover reputation stats tooltip
    View Rep
    Rep
    25
    1.5k
  13. MagnaGlobal Media Economy Report Vol.2 chart editorial graph infographic information design magazine media
    View MagnaGlobal Media Economy Report Vol.2
    MagnaGlobal Media Economy Report Vol.2
    151
    8.6k
  14. Dashboard Sketch dashboard drawing modules sketch ui
    View Dashboard Sketch
    Dashboard Sketch
    76
    2.6k
  15. Interactive Graph awesomeness design flat flat design graph interactive iphone iphone app minimal stats
    View Interactive Graph
    Interactive Graph
    561
    23.6k
  16. Lloyds Winphone 8 Account Details Expenditure Selected
    View Lloyds Winphone 8 Account Details Expenditure Selected
    Lloyds Winphone 8 Account Details Expenditure Selected
    11
    1.1k
  17. tomato - main app view for FFOS app ffos firefox interface os pomodoro timer
    View tomato - main app view for FFOS
    tomato - main app view for FFOS
    27
    2.4k
  18. a dashboard
    View a dashboard
    a dashboard
    774
    54.5k
  19. Test prep site UI clean green light red ui web design white
    View Test prep site UI
    Test prep site UI
    7
    629
  20. Savings infographic infographic webdesign
    View Savings infographic
    Savings infographic
    5
    504
  21. Profile dropdown menu avatar dropdown graph header icons menu nav orange ui web web ui website
    1
    View Profile dropdown menu
    Profile dropdown menu
    1.1k
    105k
  22. EOY 2012 Overall annual report attendance chartwell end of year finance graph illustration radial chart report
    1
    View EOY 2012 Overall
    EOY 2012 Overall
    54
    9.5k
  23. Stages of a Bubble bubble chart finance graph money old stages
    View Stages of a Bubble
    Stages of a Bubble
    15
    2.4k
  24. Kibo Group International annual report africa annual report editorial illustration pie chart
    View Kibo Group International annual report
    Kibo Group International annual report
    23
    1.4k
Loading more…