Dribbble: the community for graphic design
Shots
Shots
Designers
Explore
Popular
New and Noteworthy
Product Design
Web Design
Animation
Branding
Illustration
Mobile
Typography
Print
Hire a Designer
Browse Designers
Submit a Project Brief
Post a Job
Hiring on Dribbble
Find Jobs
Blog
Sign up
Log in
Data visualisation
Facebook icon
Share
Twitter icon
Tweet
Copy
9 Shots
•
9 Designers
Charts, tables, data visualisation, graphs
Marko Fuček
Facebook icon
Share
Twitter icon
Tweet
Copy
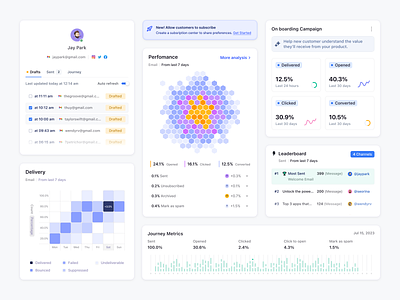
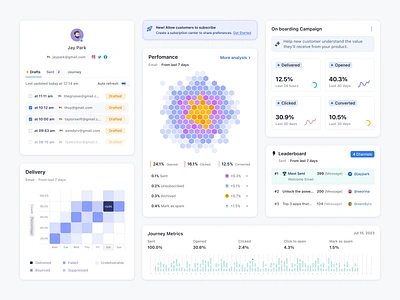
View Admin Dashboard UI Design for SaaS Web App Interfaces
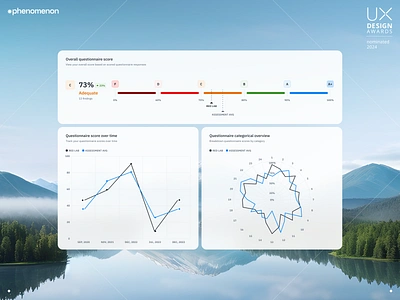
Admin Dashboard UI Design for SaaS Web App Interfaces
Like
Phenomenon Studio
Team
Like
333
178k
Shot Link
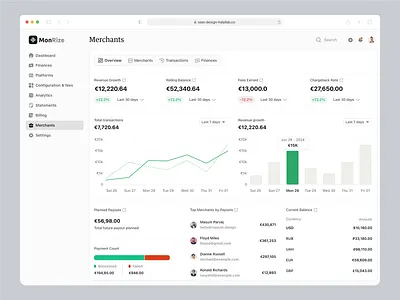
View Chart Hoverstate
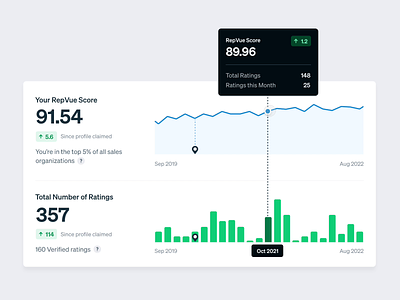
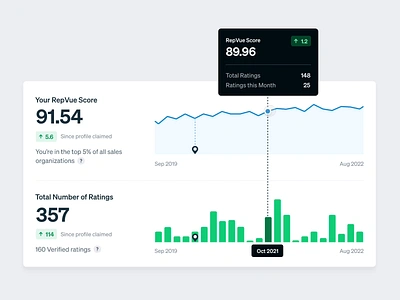
Chart Hoverstate
Like
Dreamten
Team
Like
281
103k
View Arto Plus - Pro Mode - Overview
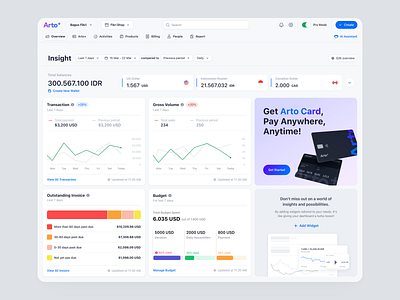
Arto Plus - Pro Mode - Overview
Like
Fikri Studio
Team
Like
149
30.6k
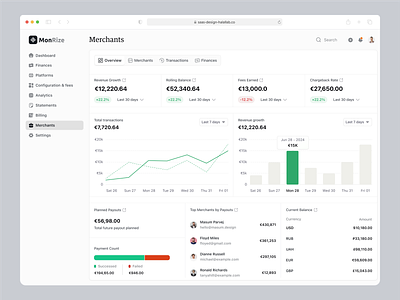
View Fintech Admin Dashboard - B2B SaaS UI/UX Design
Fintech Admin Dashboard - B2B SaaS UI/UX Design
Like
Halal Lab
Team
Like
142
21.9k
View Supercus - Dashboard Component for Marketing SaaS
Supercus - Dashboard Component for Marketing SaaS
Like
Keitoto
Team
Like
881
181k
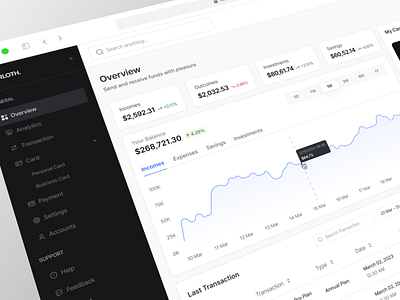
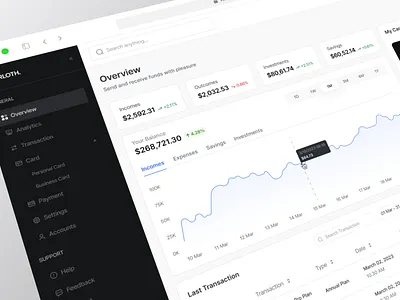
View Arloth - Financial Dashboard 💰
Arloth - Financial Dashboard 💰
Like
Keitoto
Team
Like
309
61.8k
1
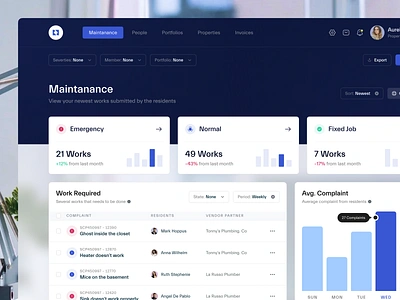
View Latchel – Property Management Dashboard
Latchel – Property Management Dashboard
Like
Vektora
Team
Like
796
186k
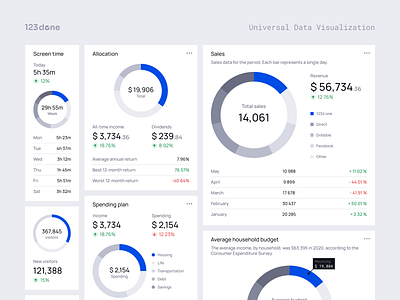
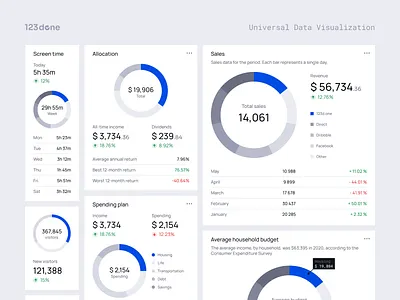
View Universal Data Visualization | Donut Chart
Universal Data Visualization | Donut Chart
Like
Dima Groshev | 123done
Like
170
76.5k
Shot Link
View OrderMetrics Reports
OrderMetrics Reports
Like
Versett
Team
Like
548
221k
Sign up to continue
Loading more…
Previous
Next
Loading…