1. Infographic Postcard data graph helvetica icons infographic visualization
    View Infographic Postcard
    Infographic Postcard
    1.4k
    96k
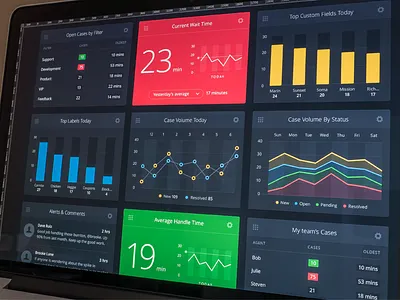
  2. Performance Dashboard analytics charts dark dashboard graphs open sans sparkline widgets
    1
    View Performance Dashboard
    Performance Dashboard
    2.1k
    209k
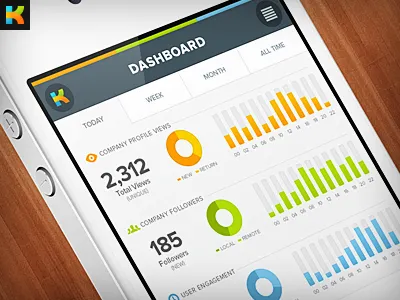
  3. Kareer.me Mobile App Preview analytics app chart culture dashboard data employment infographic iphone jobs kareer kareer.me mobile recruiting san diego startup statistics stats tabs
    View Kareer.me Mobile App Preview
    Kareer.me Mobile App Preview
    1.7k
    168k
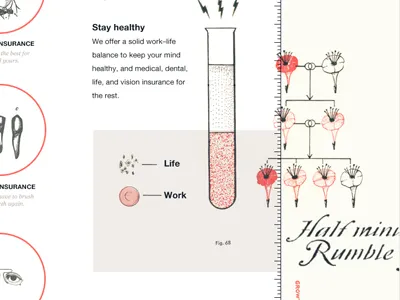
  4. Half ininute rumble effect
    View Half ininute rumble effect
    Half ininute rumble effect
    98
    2.4k
  5. Open Biola Stats biola data vis infographic information graphic open biola web
    View Open Biola Stats
    Open Biola Stats
    19
    3.3k
  6. Say hello to new guy Mat ff chartwell ideal sans
    View Say hello to new guy Mat
    Say hello to new guy Mat
    4
    389
  7. Activity Feed Illustration illustration invision ui web design
    View Activity Feed Illustration
    Activity Feed Illustration
    167
    9.2k
  8. Rocky Mountain High - Poster mountains poster
    View Rocky Mountain High - Poster
    Rocky Mountain High - Poster
    33
    972
  9. Ironman Infographic bike endurance infographic ironman kona run swim triathlon
    View Ironman Infographic
    Ironman Infographic
    101
    4.7k
  10. Icons dashboard flat icon icons report shadow survey
    View Icons
    Icons
    227
    10.8k
  11. Quartz Graphs charts graph interface iphone line graph pie chart quartz
    View Quartz Graphs
    Quartz Graphs
    316
    19k
  12. Infographic - Pie chart visualization 3d avatar chart companies facebook google infographic nutanix pie shadow thoughtspot visualization
    1
    View Infographic - Pie chart visualization
    Infographic - Pie chart visualization
    1.2k
    110k
  13. The 2012 SuperFriendly Annual Report
    View The 2012 SuperFriendly Annual Report
    The 2012 SuperFriendly Annual Report
    44
    3k
  14. Annual Report snapshot annual report illustration info graphic
    View Annual Report snapshot
    Annual Report snapshot
    63
    5.7k
  15. chart/graph (annual report) 10k annual report area graph chart graph
    View chart/graph (annual report)
    chart/graph (annual report)
    82
    6k
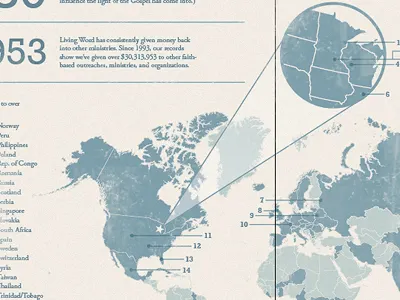
  16. Annual Report Infographic annual report blue infographic map monotone tan
    1
    View Annual Report Infographic
    Annual Report Infographic
    117
    10.9k
  17. Countdown chart dark design graph ios5 iphone minimal mobile ui ux
    1
    View Countdown
    Countdown
    1k
    66.3k
  18. Simple Stats chart data graph info medium numbers stats ui
    View Simple Stats
    Simple Stats
    2.7k
    162k
  19. xenius infographics 3d after effects art machine bar brand identity chart graph green id identity info info graphic info graphics infographics information julian hrankov motion motion design orange television tv
    View xenius infographics
    xenius infographics
    3.3k
    205k
  20. Page Number editorial layout number page
    View Page Number
    Page Number
    386
    14.5k
Loading more…