1. Nebular Graph analytics campaign cloud cumulus graph nebular stats timeline
    1
    View Nebular Graph
    Nebular Graph
    1.2k
    129k
  2. In-app Visual Data app blue buttons data icons info graphic infographic ios iphone red tab bar ui visual data yellow
    1
    View In-app Visual Data
    In-app Visual Data
    4.3k
    364k
  3. Mobile Checkout - Card Payment Screen basket button buy checkout commerce confirmation credit card form iphone iphone app progress purchase receipt retina shop shopping store ui
    View Mobile Checkout - Card Payment Screen
    Mobile Checkout - Card Payment Screen
    292
    41.9k
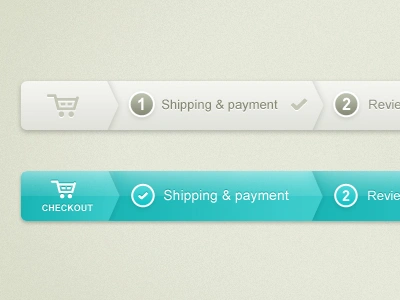
  4. Checkout progress bar - Web UI app checkout progress shopping ui
    1
    View Checkout progress bar - Web UI
    Checkout progress bar - Web UI
    765
    71k
  5. Graph chart dashboard data design glow graph interface kit statistics stats ui
    3
    View Graph
    Graph
    1.7k
    158k
  6. Intel Foundation 25th Anniversary // Infographics blue business green info graphic info graphics infographic infographics intel it
    View Intel Foundation 25th Anniversary // Infographics
    Intel Foundation 25th Anniversary // Infographics
    198
    11.5k
  7. Info + Graphics clean design infographics interactive minimal web design
    View Info + Graphics
    Info + Graphics
    287
    13.6k
  8. Completed Valldalen Infographic icons illustration infographics print
    View Completed Valldalen Infographic
    Completed Valldalen Infographic
    262
    15.3k
  9. Media Economy Report Infographic analytics data donut pie chart report statistic ui ux
    View Media Economy Report Infographic
    Media Economy Report Infographic
    527
    42.2k
  10. Olympic Dominance athletics blue chart circle countries dark data green infograph infographic map olympics red sport stats
    View Olympic Dominance
    Olympic Dominance
    641
    44.9k
  11. Infographic analysis circle data info infograph infographic infographics
    1
    View Infographic
    Infographic
    555
    31.9k
  12. Infographic - Pie chart visualization 3d avatar chart companies facebook google infographic nutanix pie shadow thoughtspot visualization
    1
    View Infographic - Pie chart visualization
    Infographic - Pie chart visualization
    1.2k
    109k
  13. Bobo Profile Page blue fitness graph green infographic orange sport statistic ui ux webdesign website
    View Bobo Profile Page
    Bobo Profile Page
    1.1k
    123k
  14. How your iPhone is made infographic iphone technology
    View How your iPhone is made
    How your iPhone is made
    1.7k
    62.9k
  15. xenius infographics 3d after effects art machine bar brand identity chart graph green id identity info info graphic info graphics infographics information julian hrankov motion motion design orange television tv
    View xenius infographics
    xenius infographics
    3.3k
    205k
Loading more…