1. Steelcase 360 Magazine Infographics data visualization editorial infographic information design magazin
    View Steelcase 360 Magazine Infographics
    Steelcase 360 Magazine Infographics
    457
    27.9k
  2. Media Economy Report Infographic analytics data donut pie chart report statistic ui ux
    View Media Economy Report Infographic
    Media Economy Report Infographic
    527
    42.2k
  3. Infographic chart data data viz graph sales
    View Infographic
    Infographic
    572
    34.3k
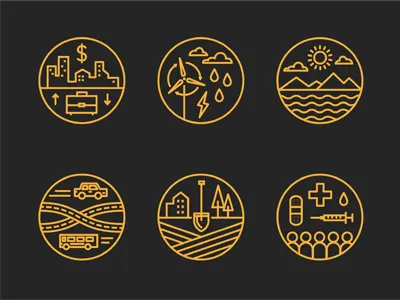
  4. Data Icons design icons illustration infographic ui website
    View Data Icons
    Data Icons
    422
    19.5k
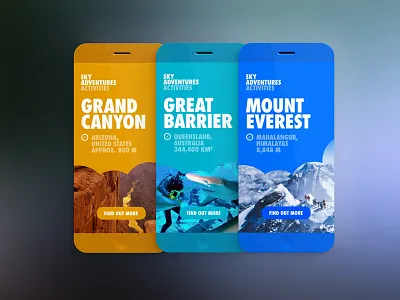
  5. SkyAdventures app brand branding color data interface iphone menu mobile ui ux vibrant
    View SkyAdventures
    SkyAdventures
    539
    20.8k
  6. the surf dial is coming... app circle circular data dial infographic ipad iphone surf texture ui wave
    View the surf dial is coming...
    the surf dial is coming...
    613
    34.9k
  7. Map pin motion data map motion pin
    View Map pin motion
    Map pin motion
    793
    49.9k
  8. Infographic Gross gathering Chart Illustration 3d annual carrot cereal chart data diagram forage glass graph graphic illustration info infographic infographics information peas plot potato report retouch visualization wheat
    View Infographic Gross gathering Chart Illustration
    Infographic Gross gathering Chart Illustration
    762
    61.6k
  9. Mixpanel Website Landing Page, Infographics data feature icon infographic interface ui
    View Mixpanel Website Landing Page, Infographics
    Mixpanel Website Landing Page, Infographics
    698
    53.9k
  10. ReportsUI app betraydan clean data design graph minimal rebound reports sketch ui
    View ReportsUI
    ReportsUI
    810
    38.2k
  11. Introducing the Surf Dial. data dial icon infographic logo texture type
    View Introducing the Surf Dial.
    Introducing the Surf Dial.
    749
    37.2k
  12. Data Visualization app interaction ios ios 8 iphone mobile ui ui animation ui design user interface ux
    1
    View Data Visualization
    Data Visualization
    1k
    73.3k
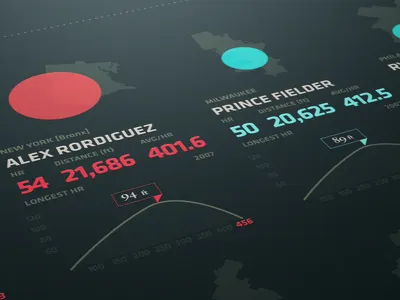
  13. Charting 5 years of MLB homeruns baseball blue chart dark data graph green infograph infographic maps mlb numbers red stats
    View Charting 5 years of MLB homeruns
    Charting 5 years of MLB homeruns
    1.4k
    120k
Loading more…