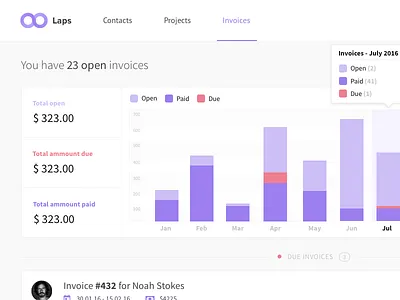
1. Charts chart dashboard graph infographics ios ios9 kit mockup psd sketch ui
    View Charts
    Charts
    159
    8.4k
  2. Dashboard analytics chart dashboard graphs line graph menu navigation pie chart sidebar
    View Dashboard
    Dashboard
    104
    13.7k
  3. Data Graphs age chart data graph line pie population ui ux web design webapp
    View Data Graphs
    Data Graphs
    298
    30k
  4. Style Tiles analytics chart dashboard graphs guide icons line graph palette pie chart sidebar style tiles table
    View Style Tiles
    Style Tiles
    49
    7.6k
  5. Dark Analytics Dashboard UI analytics charts colors dark dashboard graph ipad list menu ui ux
    View Dark Analytics Dashboard UI
    Dark Analytics Dashboard UI
    30
    3.1k
  6. Sci Fi App Comp graphic pack sci fi ui kit
    View Sci Fi App Comp
    Sci Fi App Comp
    34
    2.2k
  7. Activity Dashboard - Dark analytics bar chart dark dashboard data dial graph performance pie chart stats ui
    View Activity Dashboard - Dark
    Activity Dashboard - Dark
    68
    12.6k
  8. Webapp Sales Dashboard analytic app chart dashboard flat graph interface metrics pie stats ui web
    View Webapp Sales Dashboard
    Webapp Sales Dashboard
    130
    14k
  9. Summary Cards - Britecharts analytics card charts dashboard data library visualization
    View Summary Cards - Britecharts
    Summary Cards - Britecharts
    119
    9.5k
  10. StrefaKoloru - Dashboard clean dashboard flat strefakoloru ui
    2
    View StrefaKoloru - Dashboard
    StrefaKoloru - Dashboard
    116
    7.1k
  11. Traveler Dashboard app dashboard mobile ui ux web webdesign
    View Traveler Dashboard
    Traveler Dashboard
    263
    9.2k
  12. How well is YPlan working for you? backend dashboard infographics portal tickets ui ux
    View How well is YPlan working for you?
    How well is YPlan working for you?
    25
    2.2k
  13. Infographics chart dashboard graph infographics ios ios9 kit mockup psd sketch ui
    View Infographics
    Infographics
    228
    10.8k
  14. Wins, Loses and Draws Dashboard bookmaker tips unit graph chart header minimal clean web design online betting website red black white responsive design service landing page sport bets user experience user interface ux ui win betting invoice
    View Wins, Loses and Draws Dashboard
    Wins, Loses and Draws Dashboard
    49
    6.9k
  15. Wireframe Dashboard Explorations dashboard
    View Wireframe Dashboard Explorations
    Wireframe Dashboard Explorations
    96
    3k
  16. Light Control app control data icon illustration ios iphone light
    View Light Control
    Light Control
    122
    4.8k
  17. Sales dashboard analytics charts dashboard desktop graphs infographics kpi minimal pie sales simple stats
    View Sales dashboard
    Sales dashboard
    128
    16.2k
  18. Funda App app dashboard design finance ios money ui
    View Funda App
    Funda App
    167
    11.9k
  19. Instant Crush: Advance Data Visualization Base Template charts data data visualization fui graphs hud interface ui
    View Instant Crush: Advance Data Visualization Base Template
    Instant Crush: Advance Data Visualization Base Template
    199
    15.8k
  20. Sales Dashboard iPad • PSD Download app free app freebie ipad psd sales sales app
    View Sales Dashboard iPad • PSD Download
    Sales Dashboard iPad • PSD Download
    118
    23.5k
  21. Inovicing for getlaps.com app barchart freelancer graph invoice latvia riga stacked barchart time managment ui web web app
    View Inovicing for getlaps.com
    Inovicing for getlaps.com
    188
    13.9k
  22. Activity Dashboard - Light analytics app bar chart dashboard data dial graph performance pie stats ui website
    1
    View Activity Dashboard - Light
    Activity Dashboard - Light
    46
    8.5k
  23. Day & Night Shift android dashboard day shift eventbrite gradient icons material design money night shift
    View Day & Night Shift
    Day & Night Shift
    168
    11.2k
  24. Usage Metrics Dashboard admin app interface analytics dashboard ui application ux clean design data science data visualization graph and charts responsive application startup product ui design
    View Usage Metrics Dashboard
    Usage Metrics Dashboard
    102
    16k
Loading more…