1. Blissfully SaaS Management Dashboard dashboard dashboard app dashboard design finance minimal saas management saas platform saas web design software management to do list web app
    1
    View Blissfully SaaS Management Dashboard
    Blissfully SaaS Management Dashboard
    437
    111k
  2. Leverege Design System: Charts ae animation charts design graphs kit statistic stats system ui ux
    View Leverege Design System: Charts
    Leverege Design System: Charts
    67
    24.4k
  3. Data Visualization Toolkit analytics brand chart data data visualization dataviz finance fintech graph identity interface system
    View Data Visualization Toolkit
    Data Visualization Toolkit
    32
    7.4k
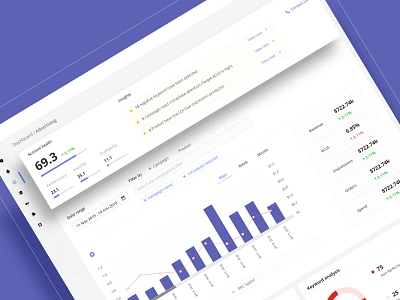
  4. Dashboard Data Visualization - SellerApp adobe xd dashboard template dashboard ui dashboarddesign data data visulization insights suggestionbox uidesign uxdesign
    View Dashboard Data Visualization - SellerApp
    Dashboard Data Visualization - SellerApp
    8
    561
  5. AI driven data insights analytics artificial intelligence cards design cards ui data data visualization ui
    View AI driven data insights
    AI driven data insights
    90
    22.3k
  6. Clora Employer Dashboard application dashboard expand light lists minimal navigation
    View Clora Employer Dashboard
    Clora Employer Dashboard
    106
    26.3k
  7. Expandable Table bar chart integration list view pipe chart platform report statistics table tabular data web app website
    View Expandable Table
    Expandable Table
    195
    120k
  8. Lisk Hub balance graph animation exploration analitycs animation data data analysis finance graph hub lisk math money price science visualisation wallet
    View Lisk Hub balance graph animation exploration
    Lisk Hub balance graph animation exploration
    83
    26.1k
  9. Sharing Analytics - Transition effect analytics bar chart chart dashboard data table data visualisation data visualization desktop enterprise form graph interface mobile dashboard motion report responsive dashboard saas statistics transition ui
    View Sharing Analytics - Transition effect
    Sharing Analytics - Transition effect
    1.3k
    340k
  10. Report Builder for NLP Platform analytics analytics chart area chart bar chart builder chart chart builder dashboard data visualisation enterprise graph legend line achart metrics report report builder report design score tabs web
    1
    View Report Builder for NLP Platform
    Report Builder for NLP Platform
    909
    302k
  11. Vacancy Info applicant chart dashboad dashboard ui description info infographic job recruit statistics stats vacancy
    1
    View Vacancy Info
    Vacancy Info
    191
    42.1k
  12. Outreach - Dashboard Concepts clean dashboard light ui ux white
    View Outreach - Dashboard Concepts
    Outreach - Dashboard Concepts
    144
    12.5k
  13. ADX: Dashboard+ admin panel adminpanel analytics app chart crm dashboard interface navigation painel shorten links tracking ui ux web web design website
    1
    View ADX: Dashboard+
    ADX: Dashboard+
    629
    70.9k
Loading more…