1. Olympic Dominance athletics blue chart circle countries dark data green infograph infographic map olympics red sport stats
    View Olympic Dominance
    Olympic Dominance
    641
    44.9k
  2. Pie Charts doughnut graph infographic pie chart
    View Pie Charts
    Pie Charts
    59
    5.6k
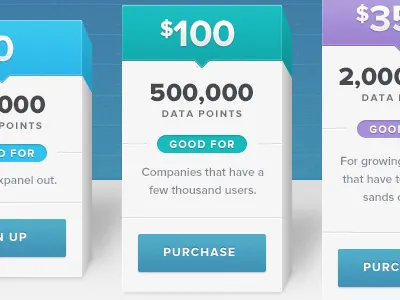
  3. 3D Pricing Page 3d blue depth green pricing proxima nova purchase purple sign up texture ui ux web design
    View 3D Pricing Page
    3D Pricing Page
    585
    48.2k
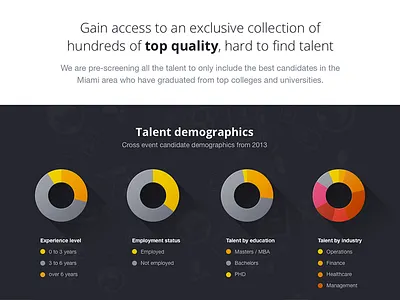
  4. Talent demographics chart charts flat landing landing page long shadow shadow web website
    View Talent demographics
    Talent demographics
    126
    6.3k
  5. Charts 2 chart clean diagnostics dial knob modern
    1
    View Charts 2
    Charts 2
    166
    5.5k
  6. Feature Page Concept blue chart depth graph mixpanel purple teal ui
    View Feature Page Concept
    Feature Page Concept
    340
    21.1k
  7. Fantasy Soccer landing page blue charts computer game count down countdown feed flags football game ios ios game landing page leagues light live points responsive rwd shadows shields soccer social sports stats teams video game web design
    1
    View Fantasy Soccer landing page
    Fantasy Soccer landing page
    764
    100k
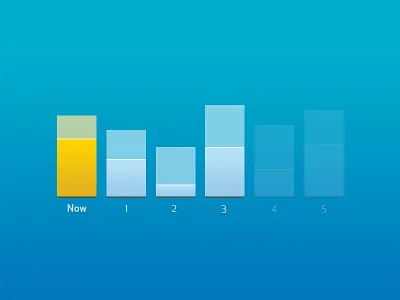
  8. Bar Concepts bar graph charts data graphs ui design
    View Bar Concepts
    Bar Concepts
    30
    4.4k
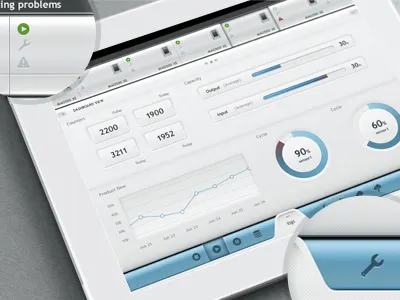
  9. White UI - Final button chart dashboard gradient graph ipad plastic progress bar ui user interface
    View White UI - Final
    White UI - Final
    1.7k
    195k
  10. Mobile Chart adlabs chart digital iji infographics iphone mobile phone
    View Mobile Chart
    Mobile Chart
    176
    7.5k
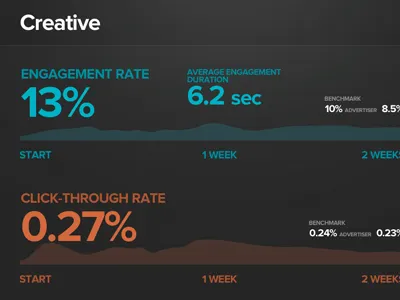
  11. Creative – Deck slide app apple creative dark data dataviz deck graph highlight infographic infoviz keynote linegraph metrics numbers presentation product slide sparkline statistics ui viz
    View Creative – Deck slide
    Creative – Deck slide
    335
    25.9k
  12. Landing Page UI, Mixpanel Engage Launch data graph icon icons infographic iphone notification orange purple push notification teal
    View Landing Page UI, Mixpanel Engage Launch
    Landing Page UI, Mixpanel Engage Launch
    664
    58.6k
  13. Infographic - Pie chart visualization 3d avatar chart companies facebook google infographic nutanix pie shadow thoughtspot visualization
    1
    View Infographic - Pie chart visualization
    Infographic - Pie chart visualization
    1.2k
    109k
  14. Timeline / homepage about us design for Mixpanel about us blue design interface mixpanel timeline ui
    View Timeline / homepage about us design for Mixpanel
    Timeline / homepage about us design for Mixpanel
    650
    80k
  15. Mixpanel analytics Infographics Graph | Data/Statistics design chart charts data design graph infographics poster statistics stats visualization
    View Mixpanel analytics Infographics Graph | Data/Statistics design
    Mixpanel analytics Infographics Graph | Data/Statistics design
    1.2k
    118k
  16. Fantasy Soccer Stats 3d assist attributes bar blue chart column computer game data diagram football game goal graph info infographic information ios light lighting product design purple shadows soccer sports statistics ui video game visualisation wireframe
    View Fantasy Soccer Stats
    Fantasy Soccer Stats
    1.1k
    144k
Loading more…