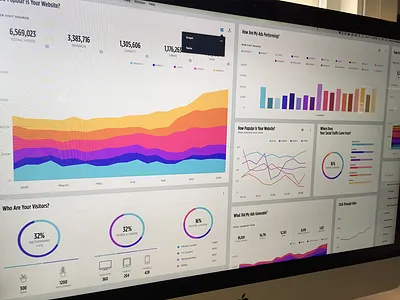
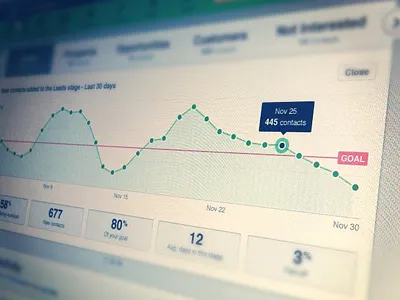
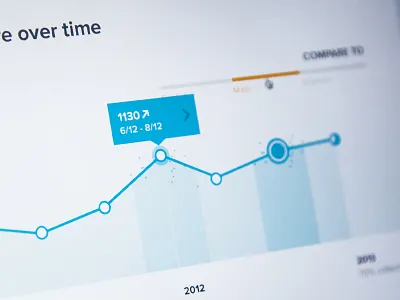
1. Radio Garden Redesign analytics dashboard interface radio reports ui user interface ux web app web application web design
    View Radio Garden Redesign
    Radio Garden Redesign
    133
    9.3k
  2. McLaren LIVE chart dashboard graph infographic ios ipad mclaren statistic tab time ui ux
    View McLaren LIVE
    McLaren LIVE
    44
    2.8k
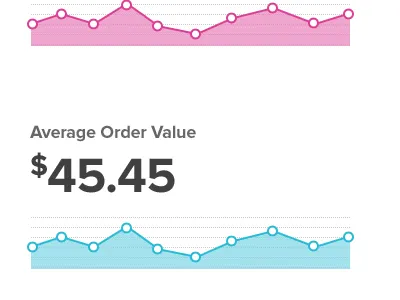
  3. Dashboard Metric Graphs chart dashboard dotted graph line metric proxima nova
    View Dashboard Metric Graphs
    Dashboard Metric Graphs
    10
    1.3k
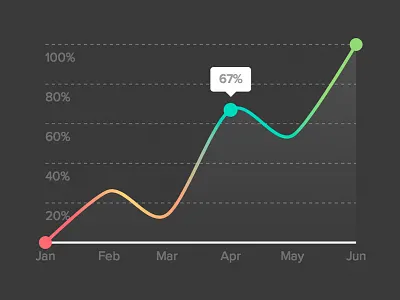
  4. D3 Gradient Sparkline Graph chart color d3 data gradient graph line number sparkline
    View D3 Gradient Sparkline Graph
    D3 Gradient Sparkline Graph
    43
    6.5k
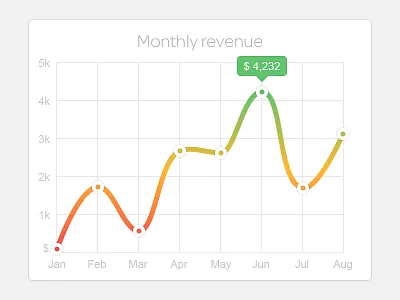
  5. Line Graph chart colour flat graph gui illustrator interface line minimal monthly revenue ui
    View Line Graph
    Line Graph
    47
    5.4k
  6. Sunset Dashboard analytics chart charts colors dashboard data graph graphs line chart line graph metrics sunset
    View Sunset Dashboard
    Sunset Dashboard
    87
    6.8k
  7. Dashboard Analytics analytics dashboard interface reports ui user interface ux web app web application web design
    1
    View Dashboard Analytics
    Dashboard Analytics
    212
    13.6k
  8. Sparkline clean data data visualization flat chart graph minimal minimal graph spark line sparkline stats trend web
    View Sparkline
    Sparkline
    521
    36.6k
  9. Real estate management and analytics tool agency analytics chart dashboard graphics list profile property real estate realty statistics
    2
    View Real estate management and analytics tool
    Real estate management and analytics tool
    170
    11.9k
  10. Datastreams analysis charts controls dashboard iot line graph sensors stats ui
    View Datastreams
    Datastreams
    163
    12.1k
  11. admin-dashboard [WIP] admin cms creartix dashboard flat graph interface simple tablet ui
    View admin-dashboard [WIP]
    admin-dashboard [WIP]
    457
    30.1k
  12. Charts dark dashboard application chart dark dashboard data donut graph line statistics table web application flat
    1
    View Charts dark dashboard
    Charts dark dashboard
    166
    14.4k
  13. Dashboard chart dashboard graph iot monitor tables ui
    View Dashboard
    Dashboard
    1k
    74.1k
  14. World Population Dashboard area bar chart dash dashboard donut graph inforgraphic interactive line pie visualization
    1
    View World Population Dashboard
    World Population Dashboard
    16
    4.2k
Loading more…