Dribbble: the community for graphic design
Shots
Shots
Designers
Explore
Popular
New and Noteworthy
Product Design
Web Design
Animation
Branding
Illustration
Mobile
Typography
Print
Hire a Designer
Browse Designers
Submit a Project Brief
Post a Job
Hiring on Dribbble
Find Jobs
Blog
Sign up
Log in
Analytics Board
Facebook icon
Share
Twitter icon
Tweet
Copy
13 Shots
•
12 Designers
Cameron E Stewart
Facebook icon
Share
Twitter icon
Tweet
Copy
Shot Link
View Fintech Product Web Transition
Fintech Product Web Transition
Like
Ramotion
Team
Like
1.5k
146k
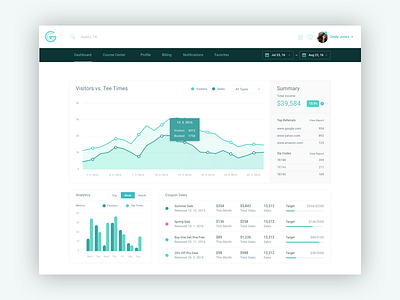
View GreatGreenFees - Course Operator Dashboard
GreatGreenFees - Course Operator Dashboard
Like
Charles Haggas
Pro
Like
55
5.3k
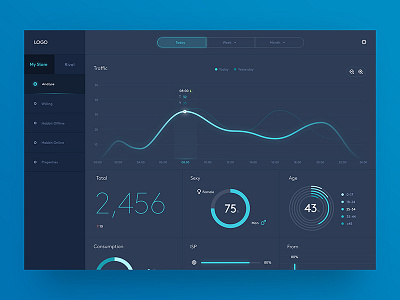
View Dashboard Web App
Dashboard Web App
Like
Minus Lab
Like
100
12k
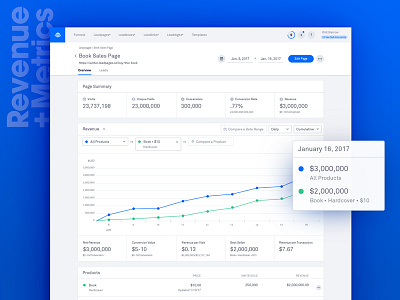
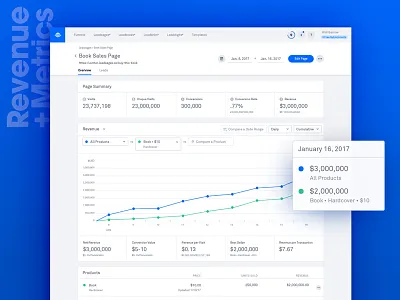
View Landing Page Dashboard UI
Landing Page Dashboard UI
Like
Leadpages
Team
Like
197
13.8k
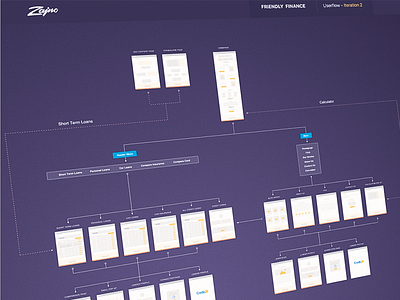
View Financial Website Site Flow
Financial Website Site Flow
Like
Bogdan Cheshik
Like
202
17k
Shot Link
View Animation Transition (Test)
Animation Transition (Test)
Like
Zane David
Like
603
51.4k
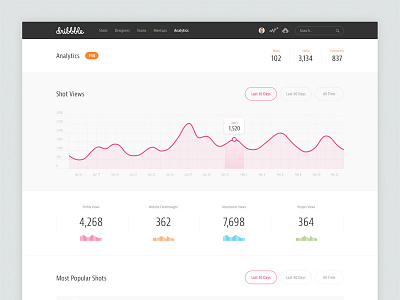
View Dribbble Analytics
Dribbble Analytics
Like
Circlebox Creative
Team
Like
735
40.7k
Shot Link
View Data visualization / Statistics / Trends Design / graph / graphs
Data visualization / Statistics / Trends Design / graph / graphs
Like
Julien Renvoye
Pro
Like
1.6k
125k
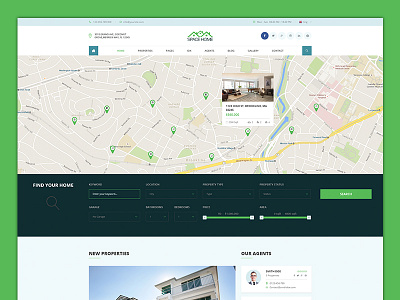
View Space Home - Version 3 with Google Map
Space Home - Version 3 with Google Map
Like
TemPlaza
Team
Like
19
7.6k
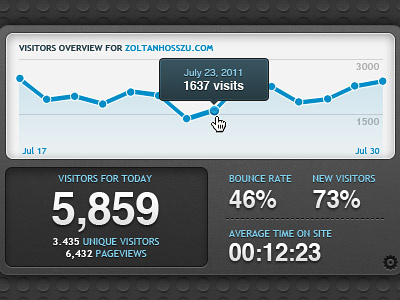
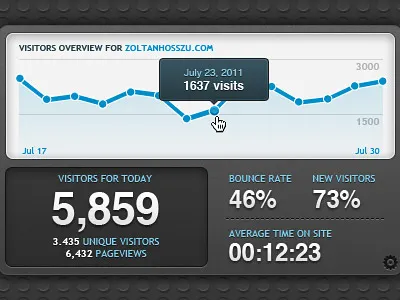
View Analytics dashboard widget
Analytics dashboard widget
Like
Zoltán Hosszú
Like
165
8.9k
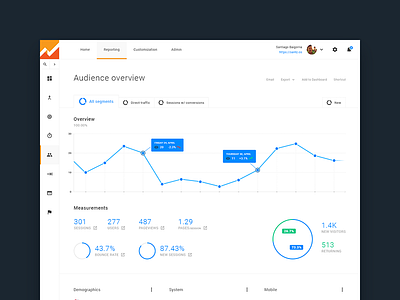
View Google Analytics • Exploration
Google Analytics • Exploration
Like
Santiago Baigorria
Like
161
9.5k
Shot Link
View Week Breakdown
Week Breakdown
Like
Swag Villains
Team
Like
700
41.9k
1
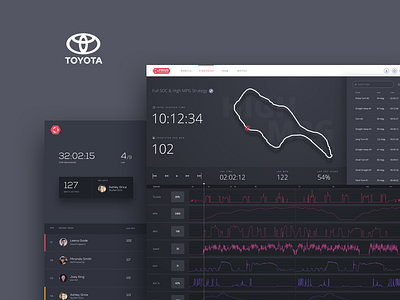
View Race Chart
Race Chart
Like
Mossio
Team
Like
287
11.7k
Sign up to continue
Loading more…
Previous
Next
Loading…