1. Chord Diagram chart chord data data visualization rainbow records sankey
    View Chord Diagram
    Chord Diagram
    30
    7.3k
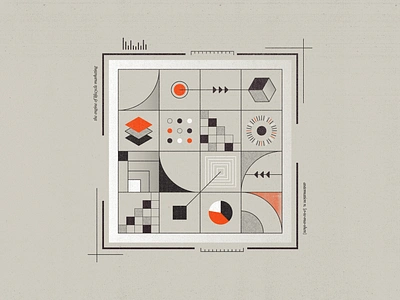
  2. Automation abstract arrow automation book brand chart collage cover cube gradient graph grid illustration marketing mechanical minimal noice symbol texture ui
    View Automation
    Automation
    243
    58k
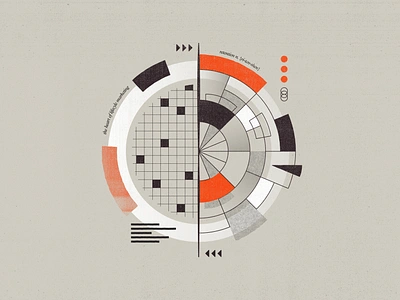
  3. Retention abstract app artwork book branding chart code collage concentric digital gradient graph grid icon illustration marketing mobile noise texture ui
    View Retention
    Retention
    357
    98.7k
  4. Update Back Office of Magic Scenario chart data design diagram graphical user interface info graphic info graphics infographic infographic design infographics sankey visualization
    View Update Back Office of Magic Scenario
    Update Back Office of Magic Scenario
    75
    20.9k
  5. Visual analysis of Fabrizio De André's vocabulary chart data data visualization datavisualization dataviz diagram drawing figure graph illustration infographic infographics information ui visualization
    View Visual analysis of Fabrizio De André's vocabulary
    Visual analysis of Fabrizio De André's vocabulary
    93
    28.9k
  6. What are we worried about? – Part 2 chart data datavisualization dataviz diagram figure illustration infographic infographics pattern texture visualization
    View What are we worried about? – Part 2
    What are we worried about? – Part 2
    19
    5.6k
  7. Deployment Dependency Diagram chart data deployment gif graph navigation product sankey ui ux visual visualisation
    View Deployment Dependency Diagram
    Deployment Dependency Diagram
    26
    10.4k
  8. Data Visualization Infographics data data is beautiful data visualization data viz infograph infographic design infographics poster poster design
    View Data Visualization Infographics
    Data Visualization Infographics
    345
    170k
  9. Orion UI kit - Charts templates & infographics in Figma desktop
    View Orion UI kit - Charts templates & infographics in Figma
    Orion UI kit - Charts templates & infographics in Figma
    95
    37.4k
  10. Orion UI kit - Charts templates & infographics in Figma mobile no code
    View Orion UI kit - Charts templates & infographics in Figma
    Orion UI kit - Charts templates & infographics in Figma
    103
    41.7k
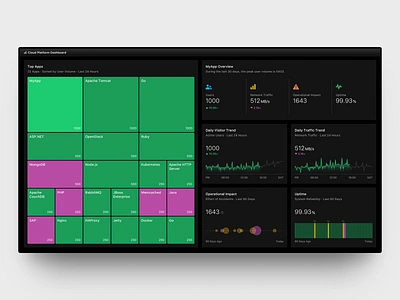
  11. Treemap Dashboard - Dark block bubble chart chart cloud dark dashboad dashboard design data design design system distribution impact infrastructure kubernetes line chart overview treemap trend ui uptime volume
    View Treemap Dashboard - Dark
    Treemap Dashboard - Dark
    317
    65.3k
  12. 🗺Thorikos d3 dashboard graph greek interactive javascript map visualisation
    View 🗺Thorikos
    🗺Thorikos
    34
    12k
  13. "Queen Four Visions" Dataviz dataviz infographic music queen sankey
    View "Queen Four Visions" Dataviz
    "Queen Four Visions" Dataviz
    103
    9.4k
  14. Team LeBron 🏀 after effects all star game animation automated basket data driven data visualisation design lebron nba stephen video
    View Team LeBron 🏀
    Team LeBron 🏀
    176
    26.9k
  15. Rugby data visualization data viz design rugby
    View Rugby
    Rugby
    20
    1.1k
  16. Ipad dashboard bars charts colors components dashboard gauge gradient graph grids ipad list
    View Ipad dashboard
    Ipad dashboard
    99
    9.3k
  17. Spindle - Flow canvas clean diagram flow learning machine simple software spindle surface ui ux
    View Spindle - Flow
    Spindle - Flow
    1.6k
    95k
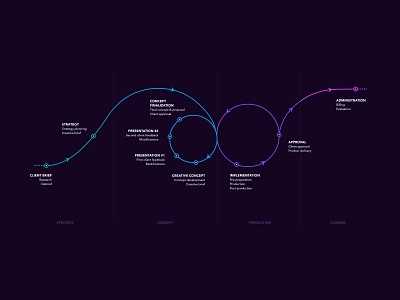
  18. How we work 📉📈 chart dark darkui data visualization flow flowchart how we work illustration neon roadmap workflow
    View How we work 📉📈
    How we work 📉📈
    214
    53.5k
  19. Choropleth 2Dto3D bootstrap4 data data mining data visualisation data visualization data viz dataviz html infographics information design interactive map javascript jquery mobile jquery ui map mapbox mapping maps storytelling uiux
    View Choropleth 2Dto3D
    Choropleth 2Dto3D
    20
    9.3k
  20. Project management background design ui ux web
    View Project management background
    Project management background
    183
    18.3k
  21. Peloton Blockchain - Trading Platform Dashboard bitcoin blockchain chart dashboard forex graph market table trade trading
    View Peloton Blockchain - Trading Platform Dashboard
    Peloton Blockchain - Trading Platform Dashboard
    193
    36.1k
  22. A printed scratch map prototype for a Cork Meets World project colour countries design foil font gold map poster print travel wine world
    View A printed scratch map prototype for a Cork Meets World project
    A printed scratch map prototype for a Cork Meets World project
    19
    3.1k
  23. Moneyboard dashboard design graphs illustration interface logo
    View Moneyboard
    Moneyboard
    28
    2.4k
  24. Dark style dashboard. EbitFX blockchain coin crypto cryptocurrency dashboard exchange google interface material ui ux web
    View Dark style dashboard. EbitFX
    Dark style dashboard. EbitFX
    23
    1.3k
Loading more…