Dribbble: the community for graphic design
Shots
Shots
Designers
Explore
Popular
New and Noteworthy
Product Design
Web Design
Animation
Branding
Illustration
Mobile
Typography
Print
Hire a Designer
Browse Designers
Submit a Project Brief
Post a Job
Hiring on Dribbble
Find Jobs
Blog
Sign up
Log in
infographics
Facebook icon
Share
Twitter icon
Tweet
Copy
8 Shots
•
8 Designers
Beatriz Martelozzo
Facebook icon
Share
Twitter icon
Tweet
Copy
Shot Link
View Presenting the 2016 Product Design Report, from InVision
Presenting the 2016 Product Design Report, from InVision
Like
InVision
Team
Like
1.5k
87.7k
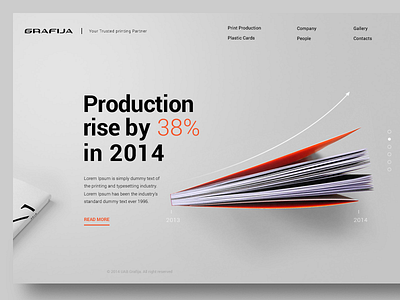
View Print House website - WIP
Print House website - WIP
Like
Gediminas Saulis
Like
1.8k
109k
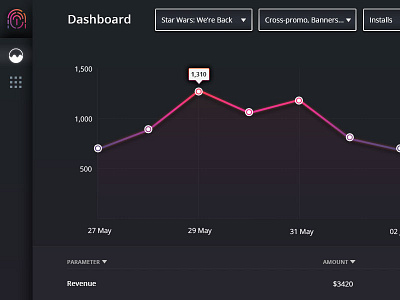
View Advertising dashboard (dark mode)
Advertising dashboard (dark mode)
Like
Illia Strikhar
Like
76
3k
View Presentation
Presentation
Like
Magdalena
Like
273
25.6k
Shot Link
View Sponseasy
Sponseasy
Like
Barthelemy Chalvet
Pro
Like
1.1k
67.4k
1
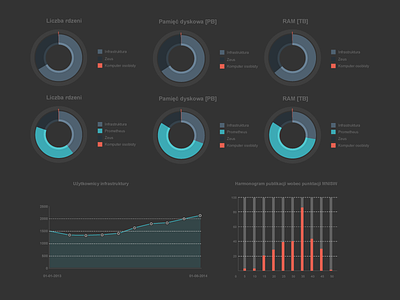
View In-app Visual Data
In-app Visual Data
Like
Jeremiah Shaw
Pro
Like
4.3k
364k
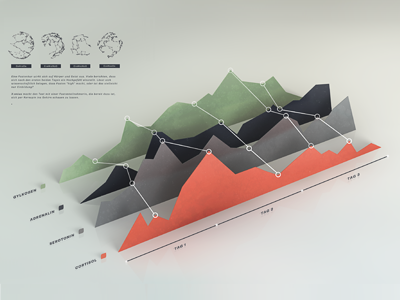
View xenius infographics
xenius infographics
Like
Julian Hrankov
Pro
Like
3.3k
205k
Shot Link
View Power Chart
Power Chart
Like
Kingyo
Like
2.9k
333k
Sign up to continue
Loading more…
Previous
Next
Loading…