1. Neutral App Icon carbon change climate emissions footprint neutral offset plant profile reforestation score subscription trees
    View Neutral App Icon
    Neutral App Icon
    114
    48.2k
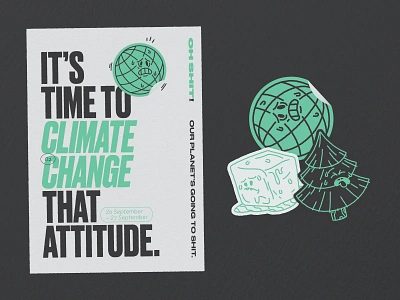
  2. Climate Change That Attitude adobe illustrator climate change environment graphic design illustration stickermule typography
    View Climate Change That Attitude
    Climate Change That Attitude
    123
    18.2k
  3. Green Pressure climate climate change earth fire future illustration innovation paint report sustainability texture trend trends vector
    View Green Pressure
    Green Pressure
    70
    22.1k
  4. Connect Earth Logo Design: Letter C + Earth + Connection branding carbon footprint carbon logo climate change connect connection logo earth earth logo energy environment global warming globe letter c logo design logo designer minimal logo modern logo nature popular logo startup logo
    View Connect Earth Logo Design: Letter C + Earth + Connection
    Connect Earth Logo Design: Letter C + Earth + Connection
    133
    93.6k
  5. The Black Embodiment Initiative black brand identity brand system branding color embodiment logo social change
    View The Black Embodiment Initiative
    The Black Embodiment Initiative
    120
    39.6k
  6. Sea Change Labs Logo agrib arrow logo branding clean logo fish fish leaf fish logo leaf leaf logo logo logo redesign logo refresh ocean logo rebrand salmon salmon logo sea sea change labs sea foam sea logo
    View Sea Change Labs Logo
    Sea Change Labs Logo
    141
    43.9k
  7. Rise Together be the change brand change dark dayton grayscale hidden meaning logo marker ohio red red and black revolution
    View Rise Together
    Rise Together
    185
    40.7k
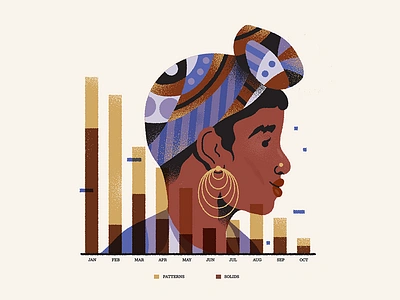
  8. Bar Chart blackwomen chart data visualization graph infographic information design pattern portrait visualization
    View Bar Chart
    Bar Chart
    254
    172k
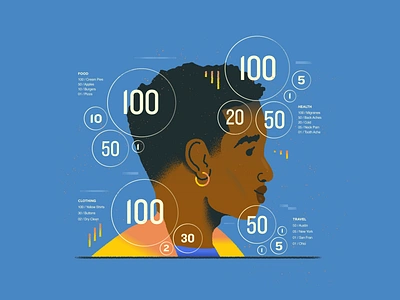
  9. Bubble chart analytics black bubblechart chart data data visualization information numbers piechart texture ui
    View Bubble chart
    Bubble chart
    231
    115k
  10. Abstract Data abstract data donut graph graph growth illustration visualization
    View Abstract Data
    Abstract Data
    148
    82.5k
  11. Abstract Data Tiers branding data data storage data tiers data visualization dataviz design illustration illustrator money storage vector
    View Abstract Data Tiers
    Abstract Data Tiers
    141
    72k
  12. Using data visualization to tell compelling stories... abstract bar chart blog chart data visualisation data visualization data viz dribbble graph infographic interview pie chart science vintage
    View Using data visualization to tell compelling stories...
    Using data visualization to tell compelling stories...
    167
    79.3k
  13. U.S. State and County Coronavirus Stats Over Time chart coronavirus data data viz dataviz graph map new york visualization
    View U.S. State and County Coronavirus Stats Over Time
    U.S. State and County Coronavirus Stats Over Time
    59
    30.4k
Loading more…