1. System Analytics analytics barchart clean dashboard graphic map report saas simple ui voit xandovoit
    View System Analytics
    System Analytics
    70
    6.3k
  2. Slack | Design Genome Project blue design design genome education grid illustrations product product illustration report typography ui user interface
    View Slack | Design Genome Project
    Slack | Design Genome Project
    718
    60.8k
  3. Google | The Design Genome Project blue design design genome education grid illustrations product product illustration report typography ui user interface
    View Google | The Design Genome Project
    Google | The Design Genome Project
    1.2k
    110k
  4. Blockchain illustration (Annual Mining Report) app app ui application banner block chain calendar ui dashboard drawing graphic icons illustration ios landing page logo design logotype mine pool ui ux design visual design visual style guide web design
    View Blockchain illustration (Annual Mining Report)
    Blockchain illustration (Annual Mining Report)
    582
    132k
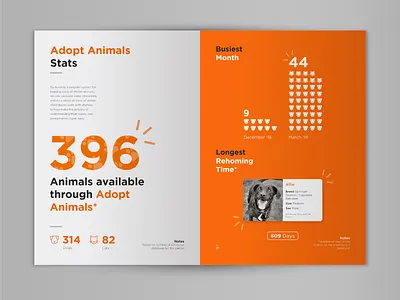
  5. Kale Charity Annual Report adoptanimals annual report booklet brand charity dog illustrator indesign orange print design
    View Kale Charity Annual Report
    Kale Charity Annual Report
    235
    76.7k
  6. YouVisit - Virtual Reality blue book cover chart color data visualization ebook infographic interface page layout statistics ui design user interface design ux design virtual reality website
    View YouVisit - Virtual Reality
    YouVisit - Virtual Reality
    157
    46.3k
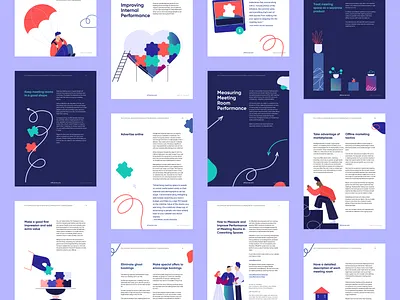
  7. Improve Performance in Coworking Spaces eBook character design ebook ebooks graphic design graphics illustration illustrations infographic infographics teamwork vector work workplace workspace
    View Improve Performance in Coworking Spaces eBook
    Improve Performance in Coworking Spaces eBook
    307
    66.3k
  8. Parcellab 2018 Infographics 2d brand chart data design graph icon icons illustration infographic parcel typography vector visualisation
    View Parcellab 2018 Infographics
    Parcellab 2018 Infographics
    59
    16.3k
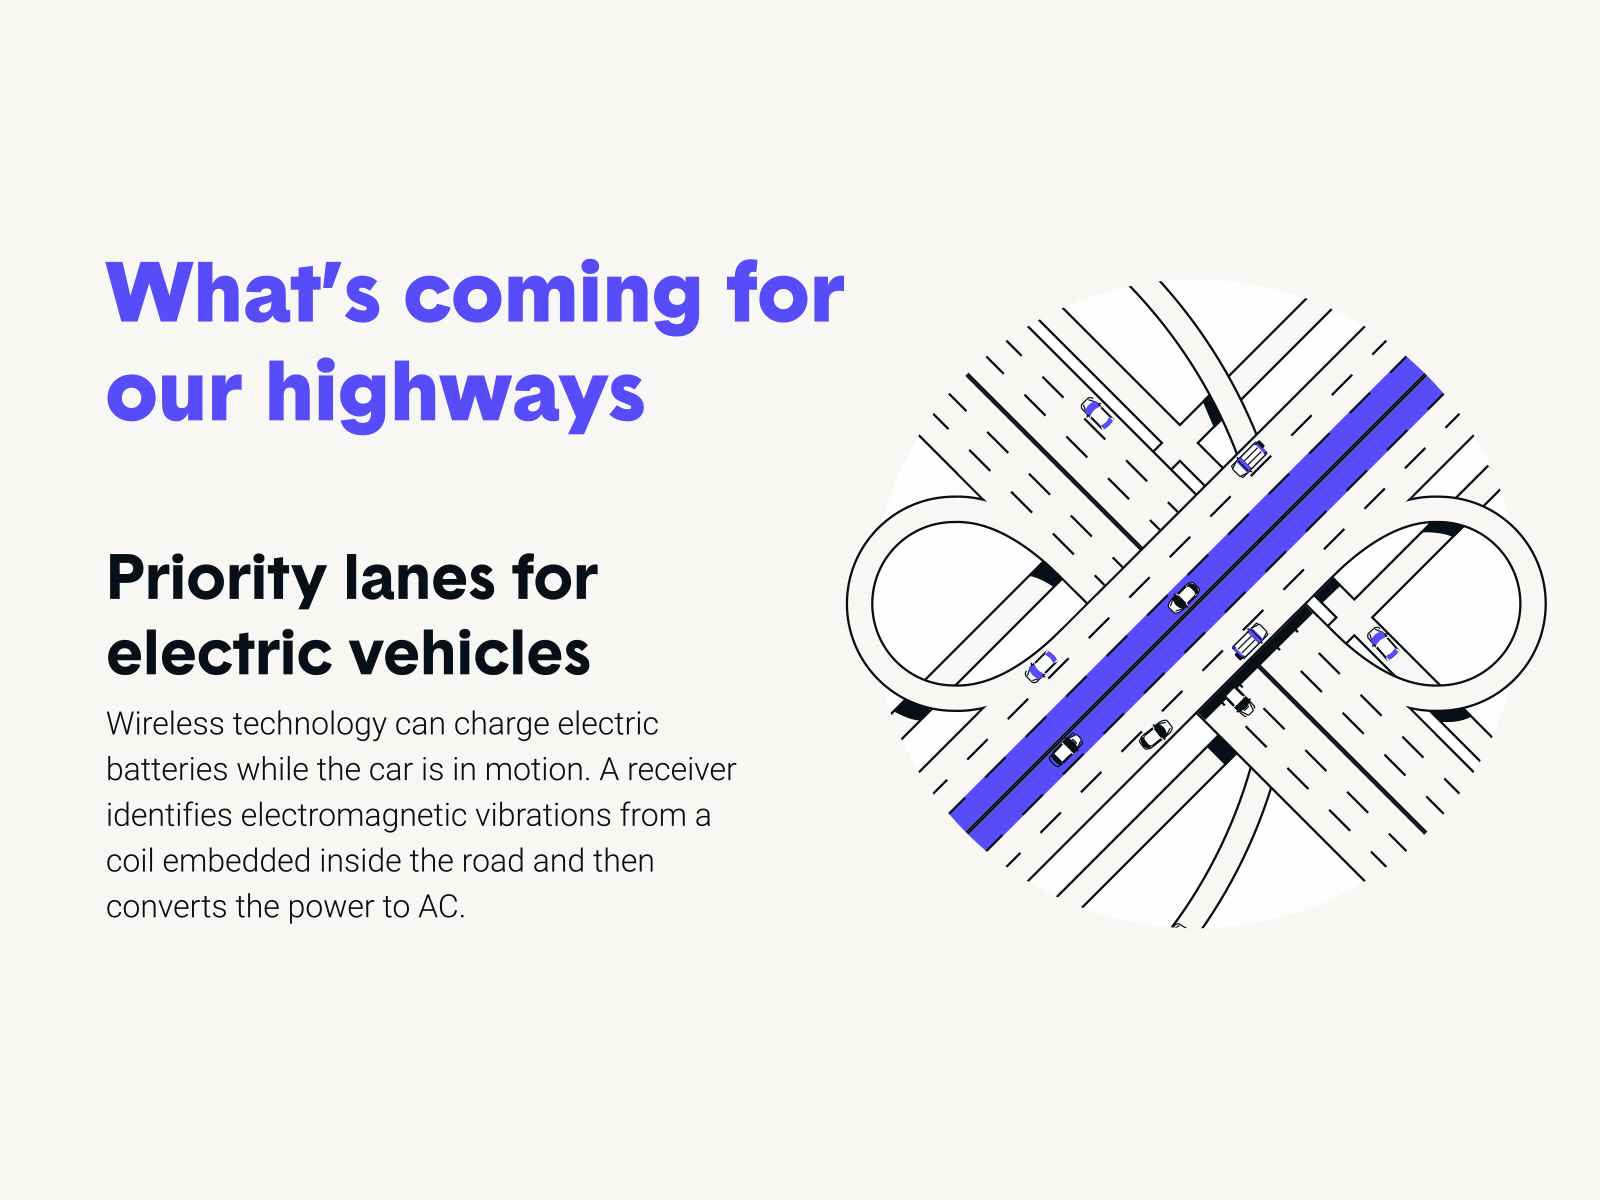
  9. How do smart highways work? (infographic) driving highways infographic information insurance thezebra
    View How do smart highways work? (infographic)
    How do smart highways work? (infographic)
    85
    23.1k
  10. Pets in Canada – infographic element animal canada cat data viz design dog flat geometric home house icon icons infographic pet simple
    View Pets in Canada – infographic element
    Pets in Canada – infographic element
    133
    59.5k
  11. Content Marketing Road Map clients content icons infographic landing page marketing one pager pattern seo
    View Content Marketing Road Map
    Content Marketing Road Map
    175
    101k
  12. Infographics flat illustration infographic vector
    View Infographics
    Infographics
    68
    31.8k
  13. SIBI - 2019 Annual Report for Property Management abstract annualreport brand branding clean geometric geometric art geometric illustration geometric shapes house illustration houses illustration illustrations illustrations/ui infographic infographic design layout metrics report visual design
    View SIBI - 2019 Annual Report for Property Management
    SIBI - 2019 Annual Report for Property Management
    230
    98.4k
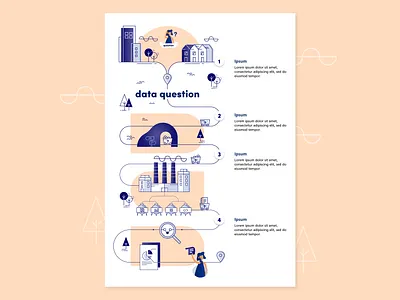
  14. Data graphic design graphicdesign illustration infographic vector
    View Data
    Data
    532
    90.5k
Loading more…