👟 Design your dream sneaker for a chance to win a FREE month of Dribbble Pro!
Join the warm-up
Dribbble: the community for graphic design
Shots
Shots
Designers
Services
Explore
Popular
New and Noteworthy
Product Design
Web Design
Animation
Branding
Illustration
Mobile
Typography
Print
Hire a Designer
Browse Freelancers
Purchase Services
Submit a Project Brief
Post a Full-Time Job
Find Jobs
Blog
Sign up
Log in
Whitebirch
Facebook icon
Share
Twitter icon
Tweet
Copy
7 Shots
•
7 Designers
Alex Endsley
Facebook icon
Share
Twitter icon
Tweet
Copy
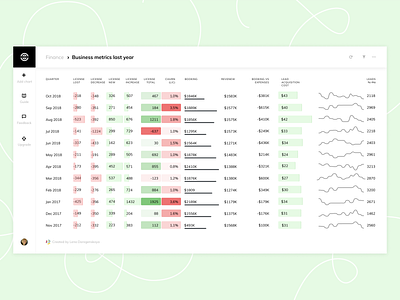
View Visual Table with SaaS metrics in Vizydrop
Visual Table with SaaS metrics in Vizydrop
Like
Targetprocess
Team
Like
134
49.8k
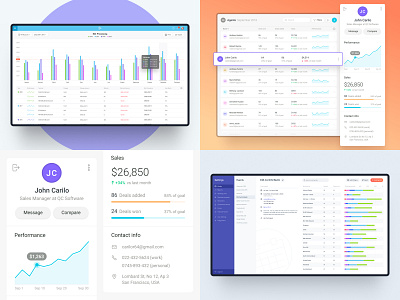
View Top 2018
Top 2018
Like
Claudiu Cioba
Like
64
9.6k
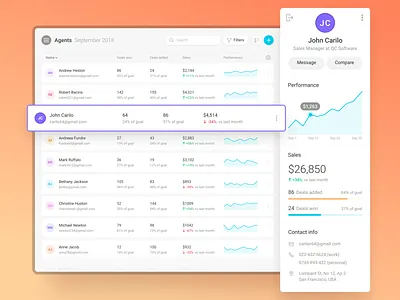
View CRM Reports
CRM Reports
Like
Claudiu Cioba
Like
388
56k
Shot Link
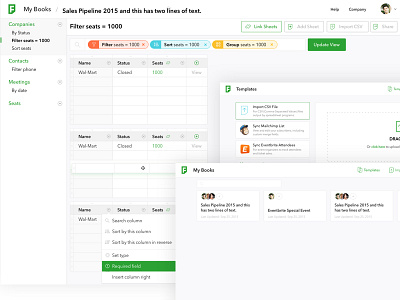
View Invocable - Bulk Editor
Invocable - Bulk Editor
Like
Gregory Muryn-Mukha
Pro
Like
1.1k
292k
Shot Link
View Create from Dropbox
Create from Dropbox
Like
Dropbox Design
Team
Like
562
102k
View Fieldbook App
Fieldbook App
Like
Series Eight
Team
Like
78
19.4k
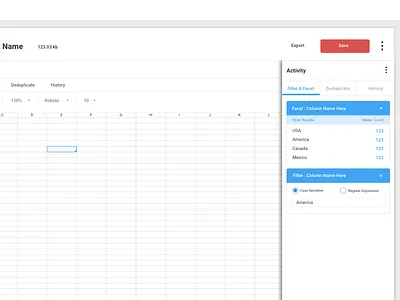
View Spreadsheet - filter/facet
Spreadsheet - filter/facet
Like
Jong
Like
41
26.6k
Sign up to continue
Loading more…
Previous
Next
Loading…