Dribbble: the community for graphic design
Shots
Shots
Designers
Explore
Popular
New and Noteworthy
Product Design
Web Design
Animation
Branding
Illustration
Mobile
Typography
Print
Hire a Designer
Browse Designers
Submit a Project Brief
Post a Job
Hiring on Dribbble
Find Jobs
Blog
Sign up
Log in
Data
Facebook icon
Share
Twitter icon
Tweet
Copy
8 Shots
•
6 Designers
Wardah Kay
Facebook icon
Share
Twitter icon
Tweet
Copy
1
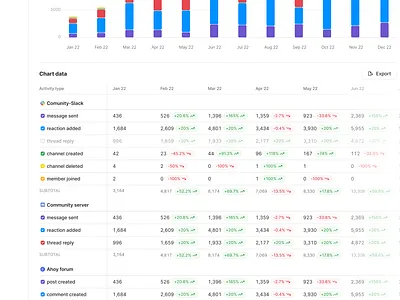
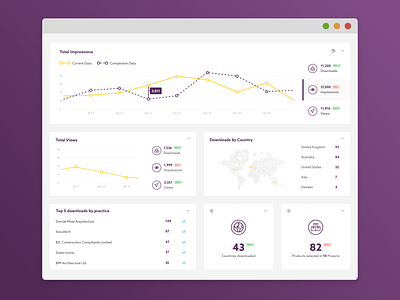
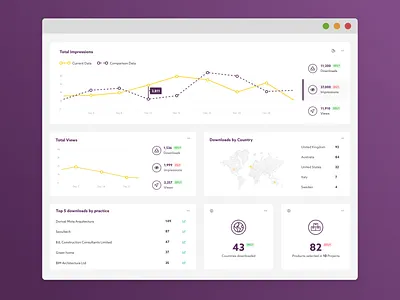
View Report - Chart Data Table with Data Groups
Report - Chart Data Table with Data Groups
Like
usrnk1
Pro
Like
293
171k
1
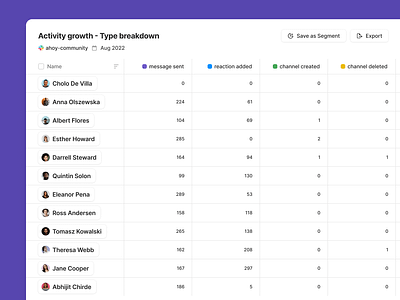
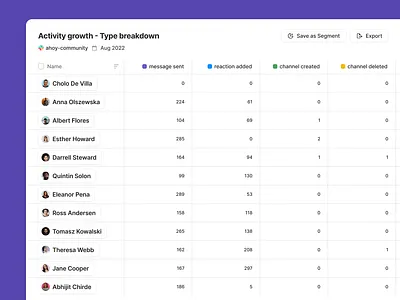
View Community Members - Report Data Table View
Community Members - Report Data Table View
Like
usrnk1
Pro
Like
174
185k
Shot Link
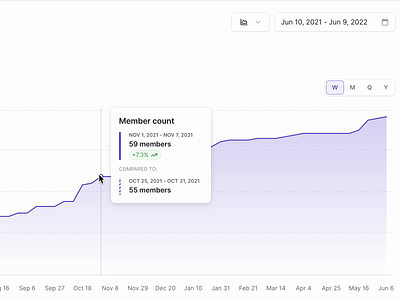
View Report View - Data Tooltip Interactions
Report View - Data Tooltip Interactions
Like
usrnk1
Pro
Like
336
124k
Shot Link
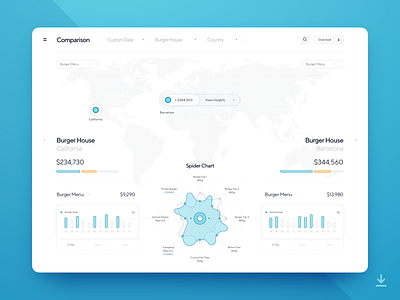
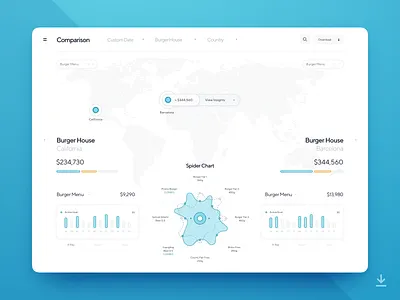
View Dashboard Spider Chart - Location Comparison SET 02-1
Dashboard Spider Chart - Location Comparison SET 02-1
Like
Dtail Studio
Team
Like
727
332k
View Dashboard UI
Dashboard UI
Like
Bradley Rutland
Like
136
90.3k
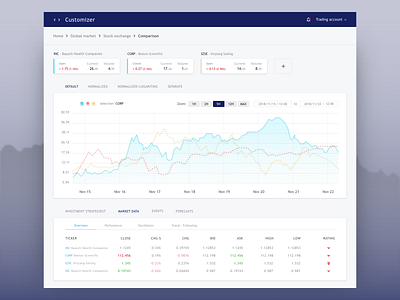
View Comparison and evaluation of financial data
Comparison and evaluation of financial data
Like
EPAM Design Team
Team
Like
267
81.8k
Shot Link
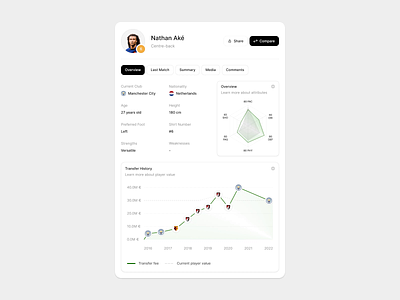
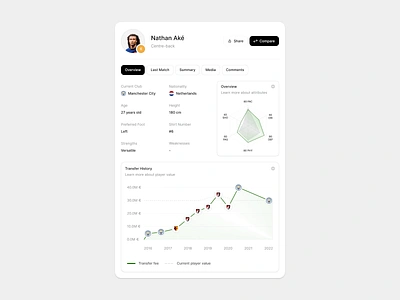
View World Cup - Comparison
World Cup - Comparison
Like
widelab
Team
Like
510
216k
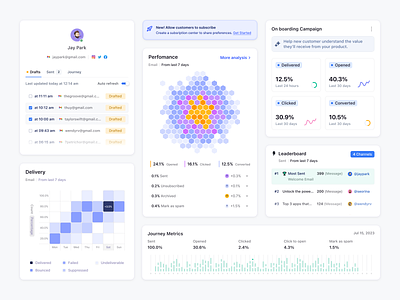
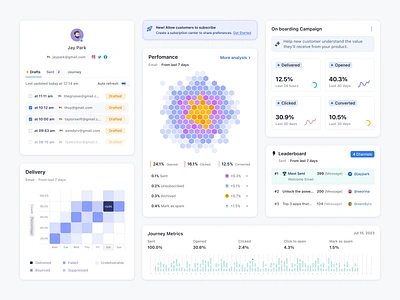
View Supercus - Dashboard Component for Marketing SaaS
Supercus - Dashboard Component for Marketing SaaS
Like
Keitoto
Team
Like
881
182k
Sign up to continue
Loading more…
Previous
Next
Loading…