Find designers
Designer search
Quickly find your next designer
Post a job
The #1 job board for design talent
Inspiration
Jobs
Go Pro
Log in
Dribbble: the community for graphic design
Log in
Sign up
UI | Data Viz
Facebook icon
Share
Twitter icon
Tweet
Copy
6 Shots
•
6 Designers
Aimee Vogelsang
Facebook icon
Share
Twitter icon
Tweet
Copy
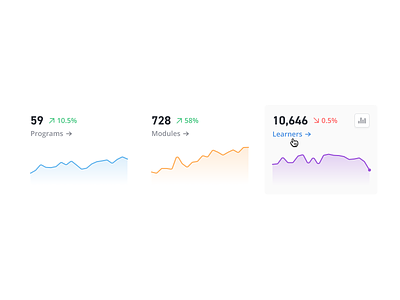
View 📈 KPI Charts
📈 KPI Charts
Like
Antoine Plu
Like
166
35k
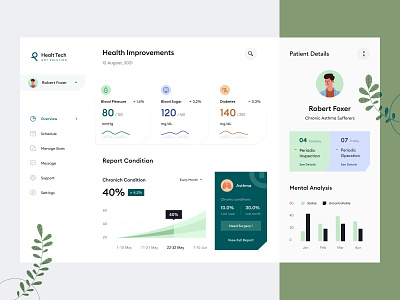
View Health Management Dashboard Design 💪
Health Management Dashboard Design 💪
Like
Orely
Team
Like
662
179k
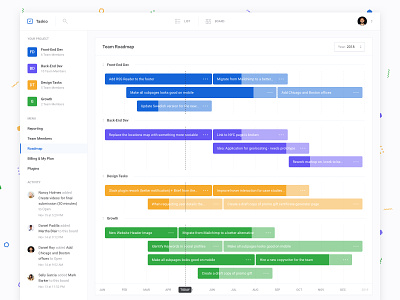
View Team Roadmap - Taskio
Team Roadmap - Taskio
Like
Jan Losert
Pro
Like
895
275k
Shot Link
View KeesdeBoekhouder – Company Statistics
KeesdeBoekhouder – Company Statistics
Like
Heavyweight
Team
Like
61
11k
Shot Link
View Line Graph - based on Echart.js
Line Graph - based on Echart.js
Like
GeeTest
Team
Like
172
78.3k
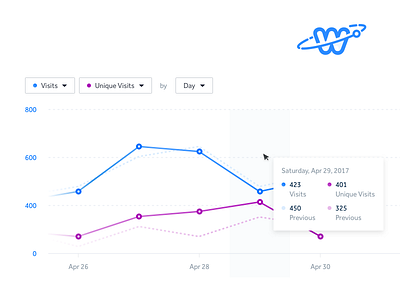
View Graphs - Weebly Orbit
Graphs - Weebly Orbit
Like
Square
Team
Like
112
15.1k
Sign up to continue
Loading more…
Previous
Next
Loading…