1. Segmentation Icon for Rule Communication 3d 3d icon blender c4d chart cinema 4d cycles data design graph icon icons ios pie pie chart render round rounded segmentation ui
    View Segmentation Icon for Rule Communication
    Segmentation Icon for Rule Communication
    127
    42.9k
  2. Onpoint - Financial Management Dashboard admin analytics app chart clean crm dashboard data design graph interface minimal panel product design report statistics stats ui ux web
    View Onpoint - Financial Management Dashboard
    Onpoint - Financial Management Dashboard
    705
    403k
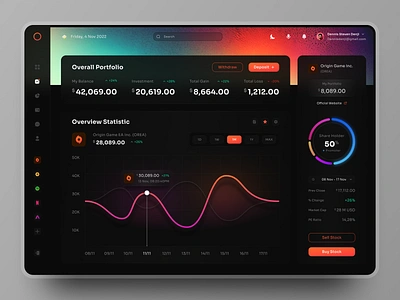
  3. Ofinans - Digital Finance Dashboard UI Concept admin dashboard admin panel admin template analytics chart dashboard dashboard app dashboard ui data finance financial fintech graph modern stats ui user dashboard user panel ux web design
    View Ofinans - Digital Finance Dashboard UI Concept
    Ofinans - Digital Finance Dashboard UI Concept
    1.8k
    682k
  4. Target abstract animations creative cyberpunk cyberpunk2077 cyborg designinspiration digital fui future futurist futuristic game glow hud minimal motiongraphics vaporwave vfx vr
    View Target
    Target
    254
    68.1k
  5. UIX abstract 2d abstract animation cel animation colors debut geometry illustration loop motion
    View UIX abstract
    UIX abstract
    67
    11.4k
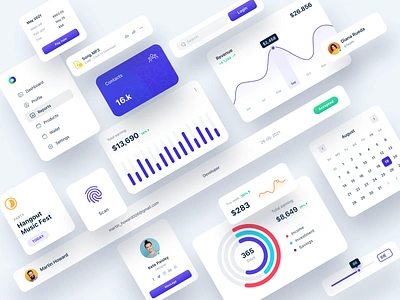
  6. UI Components | Light analytics chart clean components creative dashboard data graph landingpage library elements minimal styleguide typography ui ui kit user ux web webdesign widgets
    View UI Components | Light
    UI Components | Light
    428
    138k
  7. Sales Analytics Dashboard analysis dashboard dashboard design data data dashboard design icon interface nalytics orange orange dashboard sales sales analytics ui user interface ux
    View Sales Analytics Dashboard
    Sales Analytics Dashboard
    414
    143k
  8. Frontiers Illustration 1 - Research Topics brand character curiousity data document editorial graph illustration learning pencil research science
    1
    View Frontiers Illustration 1 - Research Topics
    Frontiers Illustration 1 - Research Topics
    45
    11.3k
  9. SEO Performance Metrics Here’s What They Mean blog chart graph illustration isometric metric performance web
    View SEO Performance Metrics Here’s What They Mean
    SEO Performance Metrics Here’s What They Mean
    46
    12.9k
  10. Ads mobile app ad app blue card chart clean covid dashboard green icon illustration landing medic mobile profile purple rocket stats ui website
    View Ads mobile app
    Ads mobile app
    652
    202k
  11. Smart Home App app chart dashboard energy gauge graph home house indicator ios real estate remote rent statistics stats tablet temperature ui ux web
    5
    View Smart Home App
    Smart Home App
    6k
    1m
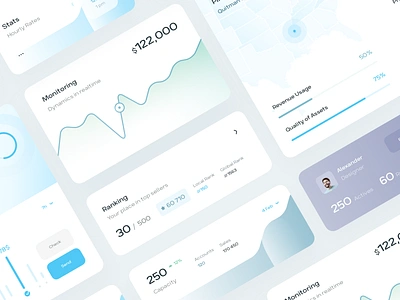
  12. Dashboard Cards and UI Elements analysis blue dashboard cards cards ui charts dashboard dashboard elements data elements finance georgia graph interface map modules sandro tavartkiladze sky blue statistics stats tbilisi
    View Dashboard Cards and UI Elements
    Dashboard Cards and UI Elements
    490
    125k
  13. Glass UI Elements app calendar cards chart dashboard elements gradient graph icons illustration kit map mobile modern stats ui web
    View Glass UI Elements
    Glass UI Elements
    1.4k
    521k
Loading more…