Dribbble: the community for graphic design
Shots
Shots
Designers
Explore
Popular
New and Noteworthy
Product Design
Web Design
Animation
Branding
Illustration
Mobile
Typography
Print
Hire a Designer
Browse Designers
Submit a Project Brief
Post a Job
Hiring on Dribbble
Find Jobs
Blog
Sign up
Log in
reporting/monitoring
Facebook icon
Share
Twitter icon
Tweet
Copy
5 Shots
•
5 Designers
Tareq Nabulsi
Facebook icon
Share
Twitter icon
Tweet
Copy
View Analytics
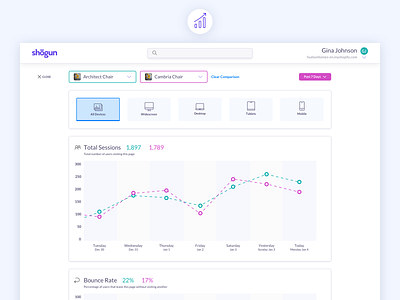
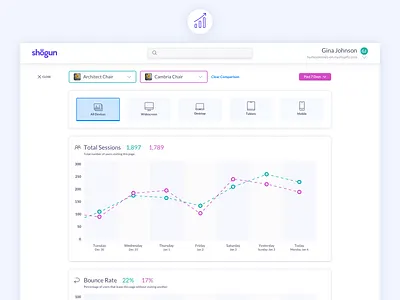
Analytics
Like
Shogun
Team
Like
62
34.7k
View Line chart analytics component
Line chart analytics component
Like
Christos
Pro
Like
160
203k
Shot Link
View Infograph
Infograph
Like
Yingfang Xie
Like
44
14.5k
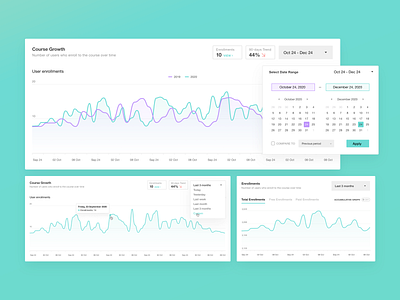
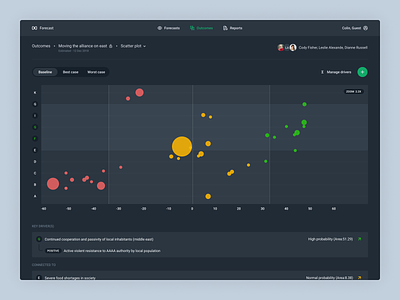
View Forecast
Forecast
Like
Ilya Sivakov
Like
201
43.8k
Shot Link
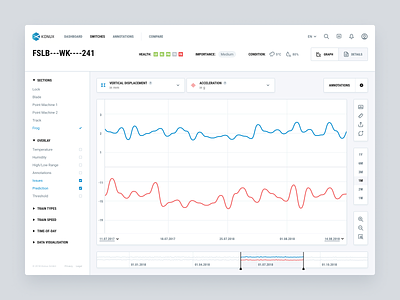
View Train switch data viz
Train switch data viz
Like
Nic Stauber
Pro
Like
97
121k
Sign up to continue
Loading more…
Previous
Next
Loading…