Hi folks 👋!
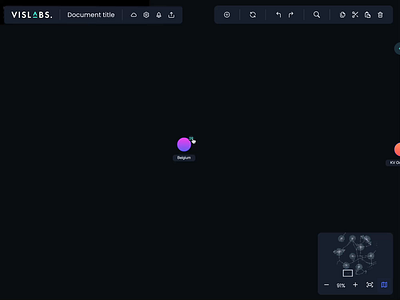
The graphical user interface makes all the data mining and processing quite simple 😊. How? Two vertical sidebars enrich the graphic user interface to enable submenu usage with more specific functions 🤓. The diagram itself ...
Hi folks 👋!
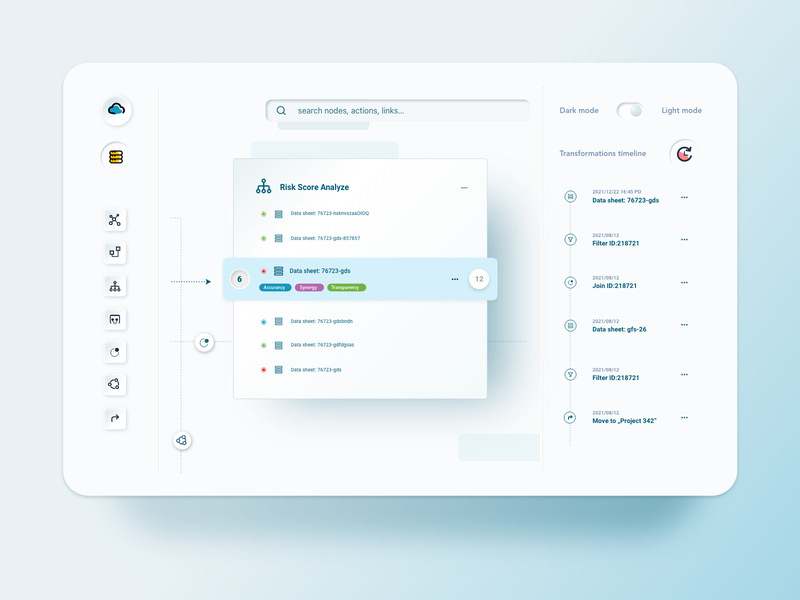
Our diagrams for data mining are equipped with timelines ⌛. They enable present changes in each record during a specific time. Meanwhile, the integrated table component allows the user to look over the separate datasheet 📝...
Hello, ya'll 👋!
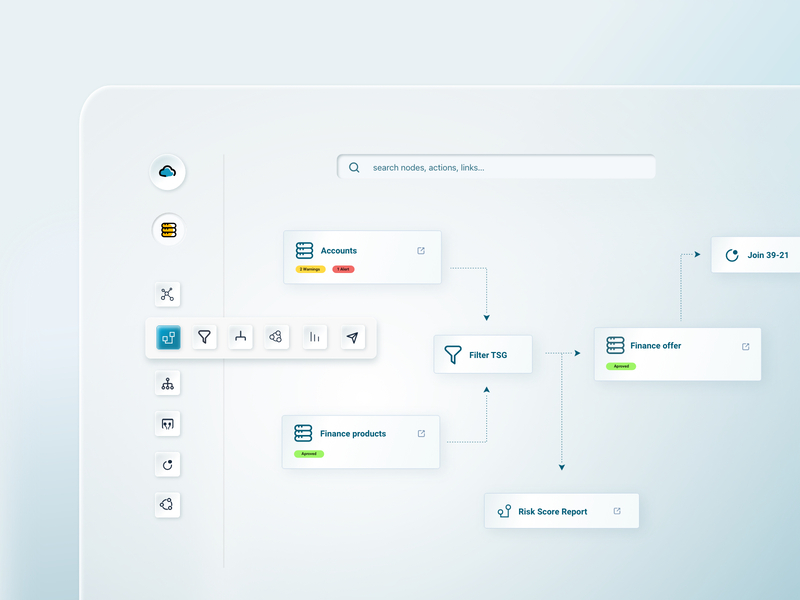
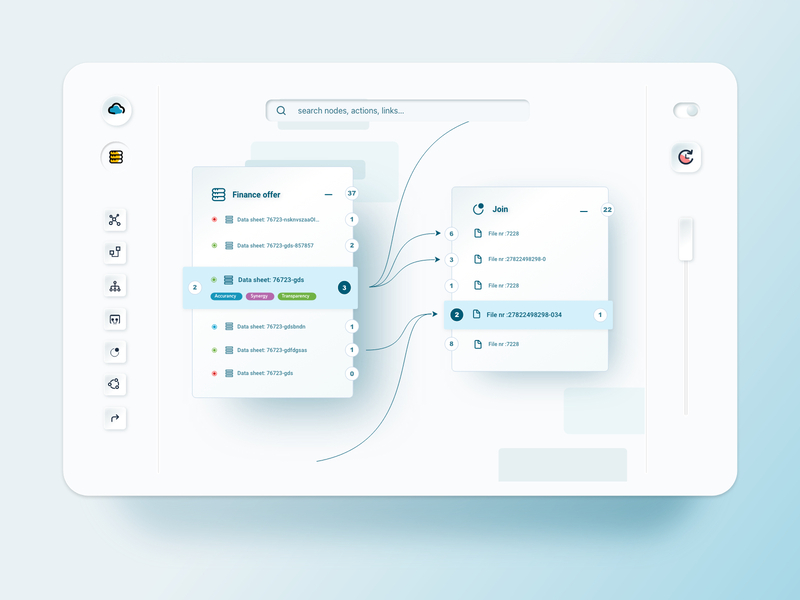
Diagrams can provide the users with a deep dive into the specific information flow 👍. With the expandable nodes, you can read all necessary data details with just one click action 🤩. It enables the user to discover dep...